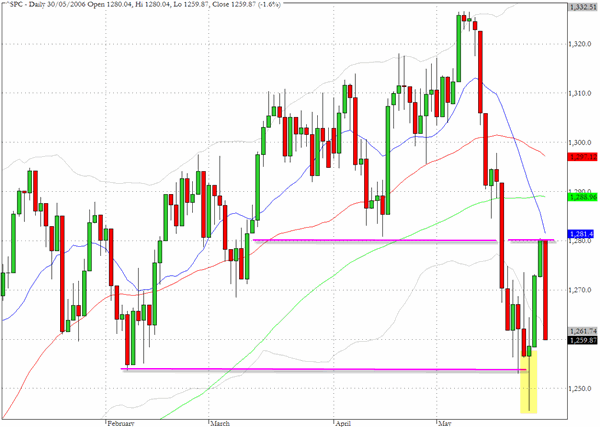
Increasing volatility has been the hallmark for trading throughout May and yesterday's swift return back towards a probing of the lows suggests that this could remain a feature of daily activity for some time. The S&P 500 which closed before the long weekend at exactly the 1280 resistance level that we anticipated in last Friday's commentary reversed abruptly in yesterday's trading back towards the recent lows closer to 1250. A test of the intraday low of 1245 achieved on May 24 is to be expected and we may find that traders will take some convincing that this level can withstand another serious downdraft.
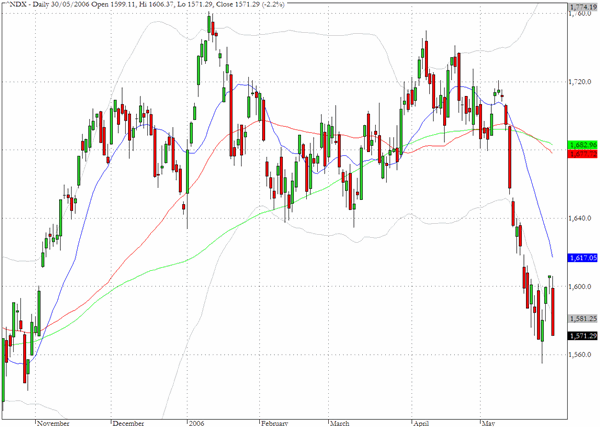
The Nasdaq 100 (^NDX) recorded a 2.2% drop yesterday and the October lows that we have indicated on the chart seem too close to avoid a re-testing in coming sessions. Despite the severity of yesterday's declines there was less than average volume on the QQQQ proxy for this index as indeed was also the case for SPY and IWM.
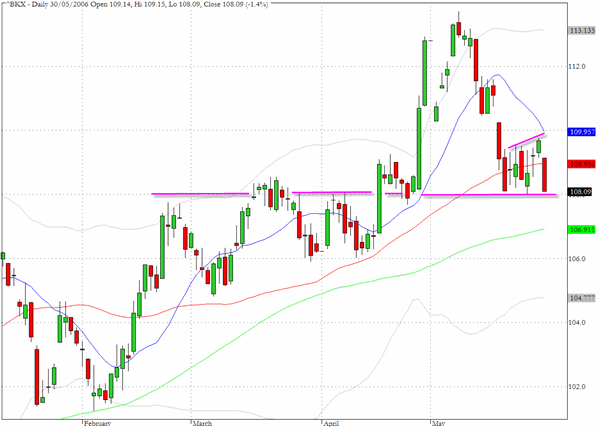
The chart for the banking index (^BKX) shows how the sector has retreated to the pre-breakout levels that took the index in late April above 113. The 108 level may now provide some support if the validity of the breakout is to be preserved although the chart formation could also be construed as a bearish flag formation in the making.
One news item from yesterday that caught our eye was the following report on the growing number of errors that are occuring in the construction of certain derivatives that are becoming a vital part of the major banks√Ę‚,¨‚"Ę repertoire of financial engineering products.
LONDON (Reuters) - Errors in trading complex credit derivatives soared in 2005, boosting risk among the world√Ę‚,¨‚"Ęs largest financial institutions, according to the International Swaps and Derivatives Association (ISDA).Seventeen percent of credit derivative trade tickets contained errors, ISDA said, compared with 9 percent in 2004. The biggest rise in errors was at large firms, the association said, where 20 percent of front-office tickets contained mistakes against 11 percent the previous year.
As we discussed recently in one of our columns the recent market upheaval has some similarity with previous financial contagion episodes such as the Russian debt crisis and LTCM debacle, and the Asian crisis prompted by the devaluation of the Thai baht in 1997.
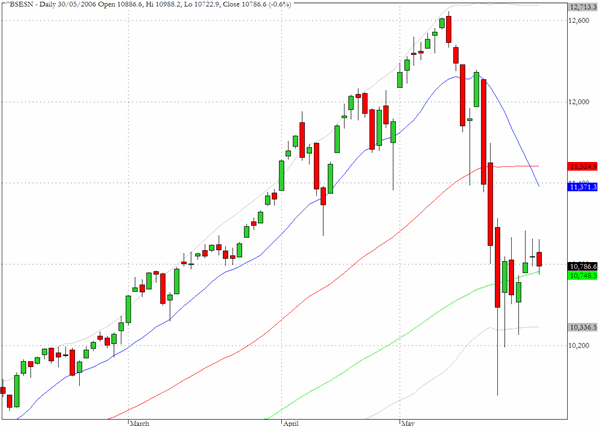
There has been a lot of fallout in the capital markets of the so-called emerging markets and one of the main casualties has been the Indian Stock Exchange. The chart below is for the BSE Sensex index which has declined by more than 2000 points during the past month and as this is being written the index is down a further 3% (not included on the chart as the market is still trading).
Reviewing the technical conditions of many different global markets, equity, debt and commodities, suggest that global trading desks have a lot more concerns than just the question of whether the Federal Reserve is almost finished with its rate hikes.
TRADE OPPORTUNITIES/SETUPS FOR WEDNESDAY MAY 31, 2006
The patterns identified below should be considered as indicative of eventual price direction in forthcoming trading sessions. None of these setups should be seen as specifically opportune for the current trading session.
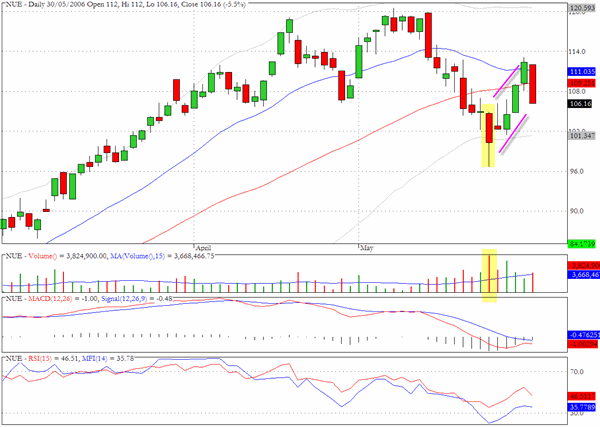
Nucor (NUE) may try to recover from yesterday's drop but there is a real possibility that the stock will stall out and register a lower high.
Genzyme (GENZ) is showing little correlation with the overall market and could move up towards the 50 day EMA at $62 as part of an attempt to recover the gap down from mid April.

Clive Corcoran is the publisher of TradeWithForm.com, which provides daily analysis and commentary on the US stock market. He specializes in market neutral investing and and is currently working on a book about the benefits of trading with long/short strategies, which is scheduled for publication later this year.
Disclaimer
The purpose of this article is to offer you the chance to review the trading methodology, risk reduction strategies and portfolio construction techniques described at tradewithform.com. There is no guarantee that the trading strategies advocated will be profitable. Moreover, there is a risk that following these strategies will lead to loss of capital. Past results are no guarante of future results. Trading stocks and CFD's can yield large rewards, but also has large potential risks. Trading with leverage can be especially risky. You should be fully aware of the risks of trading in the capital markets. You are strongly advised not to trade with capital you cannot afford to lose. This article is neither a solicitation nor an offer to buy or sell securities.