NASDAQ Commentary
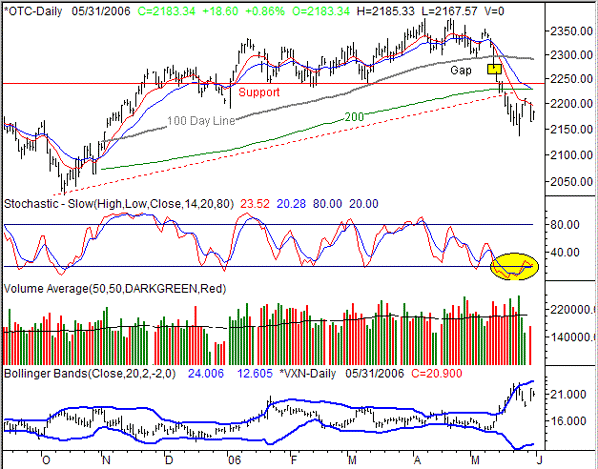
Despite today's 18.6 point lift (+0.86%), the NASDAQ is still in the red by 27.03 points (-1.22%) for the week, thanks to Tuesday's big selloff. And in terms of the bigger picture, the composite's chart still looks more bearish than bullish.
Not only is the NASDAQ under all of its key moving average lines, it also failed to get back and stay above the 10 day average with last Friday's (and last week's) bullish move. On the other hand, it takes more than one day to start and end a major trend. The fact of the matter is that the NASDAQ is still very oversold, and it has managed to at least tread water over the last week or so. At the same time, the VXN is also well under its recent peak of 23.55, and isn't giving any particular sign that it's itching to head higher. Simultaneously, the composite is holding above last week's lows. So, we could go either way here.
The best thing to do is stay patient. We said that in the Weekly Market Outlook too, but the advice still applies. The 200 day line and the 20 day line are both at 2227; only a close above that line should be considered bullish. We'll have to get under last week's low of 2135.8 to get really bearish again.
NASDAQ Chart 
S&P 500 Commentary
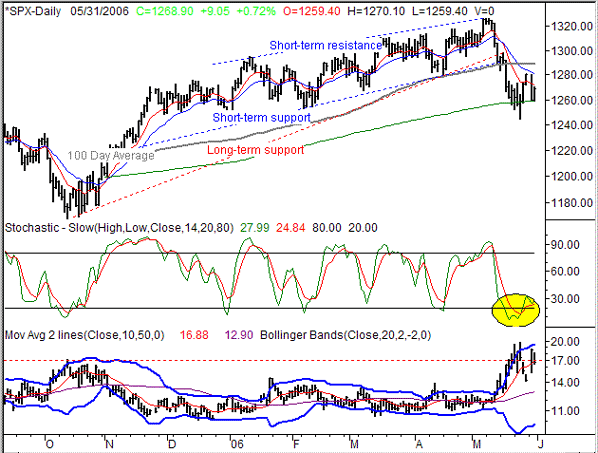
The S&P 500 is currently at 1268.90. That's 9.05 points (+0.72%) better than yesterday's close, but still leaves the large-cap index in the hole by 11.25 points (-0.88%) for the shortened week. However, the SPX chart has a few bullish qualities that are giving it a slim chance at a recovery.
In a nutshell, the bulls have made a fairy impressive stand at the 200 day line. The S&P fell straight to it, but once touched, the bleeding stopped. In fact, we've seen a mediocre effort to rally off of the 200 day line.....it just didn't take hold. Instead, the sellers came back strong after the long Memorial day weekend, sending the index lower right out of the gate. Now the S&P 500 is trapped between the 10 day line and the 200 day line, but that condition won't last for long.....the two line are on an intercept course, and will force the market to make a move soon.
So where did last week's strength come from? Primarily, an extreme oversold condition sparked a quick bounce. That, and an over-extended VIX. But the SPX as well as the VIX chart have both stabilized, evidenced by the fact that both indices are about where they were as of May 17th. Now that the initial volatility has become history and the pieces are being sorted out, we expect a more stable trend to develop (or continue, as the case may be). As for the S&P 500, even if we see a few more bullish pushes, we still see too much resistance above. And now that so much technical damage has been inflicted, it will be much easier to send the S&P 500 under the 200 day moving average line. It didn't happen with the last pass, but if we see a couple of lower and lower closes under 1260, then take the warning.
Conversely, only a couple of closes back above the 100 day line at 1289 would convince us to get bullish again.
S&P 500 Chart 
Dow Jones Industrial Average Commentary
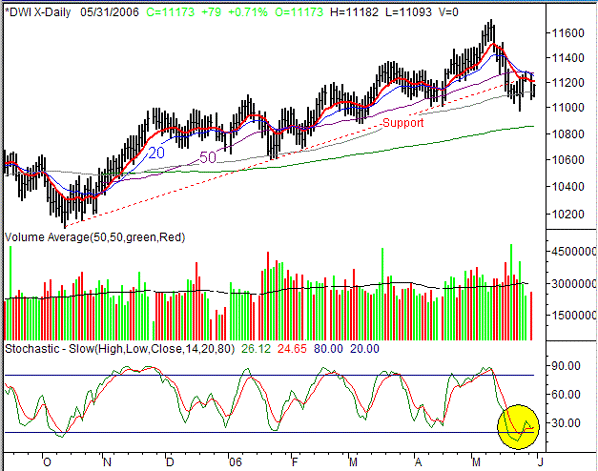
The Dow's 79 point gain today (so far) leaves the blue-chip index at 11,173, which is a 0.71% improvement for the day. But for the week, the industrial average is still down by 106 points, or 0.94%. Like the S&P 500 though, there are some bullish stragglers here that may keep the index aloft long enough to get it going upward again.
Specifically, the 100 day moving average has been support over the last several days. Although there have been a few dips under it - and even a couple of closes under it - we've not seen the Dow give any strong hints that it's going to break under that line. As of today, the 100 day average is at 11,124.
On the flipside, the Dow has been unable to trade above the 50 or 20 day average lines since falling under them a couple of weeks ago. In fact, last Friday and yesterday were pretty good challenges of both moving average lines, but neither actually did the job. It may just be a case where too much damage has already been done.
As for how to handle it, patience is going to be needed. The Dow is being squeezed by converging short-term and intermediate-term moving average lines. In fact, the 20 day and the 100 day line are only 130 points apart, and the Dow is using every bit of that range. Eventually, one side or the other will have to break. You may want to wait for that to happen before jumping in with a new trade.
Dow Jones Industrial Average Chart 
Price Headley is the founder and chief analyst of BigTrends.com.