Last week we noted that the market was severely oversold and due for a rally -- but warned that any such rally was likely to be sharp, but short-lived. So far, the market has rallied every day since then, with one major exception: a nasty 185-point Dow decline this past Tuesday. The oversold conditions have largely abated now, and the market is about to run into more severe resistance (not to mention the fact that the seasonal buying that takes place around the beginning of the month is about to end). Therefore, we don't feel this rally has much more room to run, despite the fact that it has looked quite strong at times.
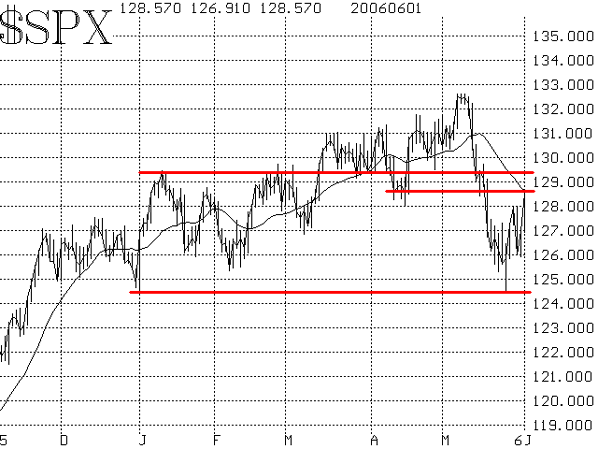
$SPX now sports a double bottom on its chart at 1245 -- those having occurred on the first day of this year and then again last week. That level, therefore, defines the major support level. This rally has overcome several resistance levels, most notably the one at 1280. However, it is now confronting the 1290 area, which has been both support and resistance at times this year (see Figure 1). More importantly, the declining 20-day moving average is at that level as well and that average often is the halting point for initial reflex rallies, such as the one we've had.

Market breadth has improved drastically. A week ago, we were seeing oversold conditions that hadn't been equaled for over a year. But now, breadth has returned to a neutral reading and, doesn't have the attractiveness that it did a week ago.
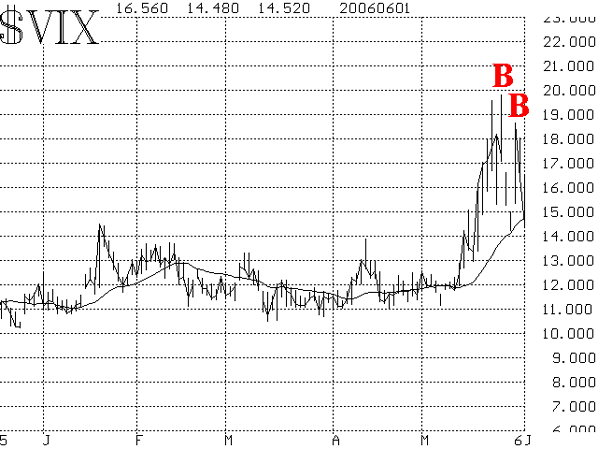
The volatility indices ($VIX and $VXO) have done a couple of round trips of their own -- registering oversold spikes and then buy signals a couple of times. In fact, late last week it appeared that $VIX had seen its highs, having fallen from above 19 to nearly 14. However, this past Tuesday -- when the Dow dropped 185 points -- $VIX rose by an enormous 4.40 points (its 10th largest one day percentage gain in its history) and closed at a new high. Since then, it has dropped precipitously, and is back below 15 again.

These gyrations in $SPX, breadth and $VIX underscore how volatile the market has become. Surprisingly, index option traders are not acknowledging that this volatility could continue -- having allowed $VIX to tank as it has. Personally, we feel that a much more volatile atmosphere will persist, but only time will tell for sure.

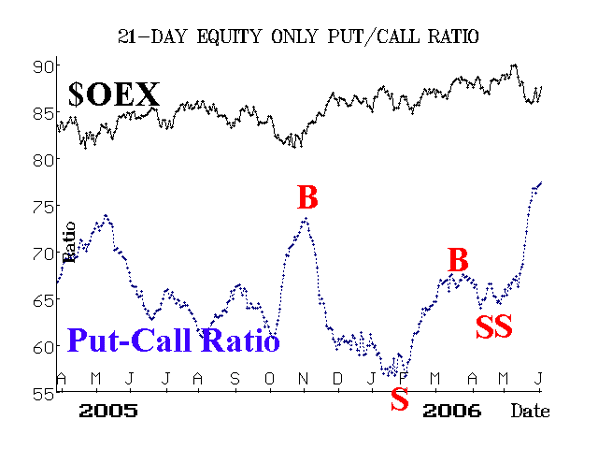
Finally, the equity-only put-call ratios have not turned bullish, although they are high on their charts (Figures 2 and 3). Remember, though, that "high" in one year is not necessarily "high" in another (these ratios reached the 90 level during 2002). That's why we prefer to wait for them to roll over and begin to head downward before we declare them as a "buy." If these turn bullish, the current rally could develop into something more substantial. But so far they haven't.

In summary, we still fee that this market suffered some serious intermediate- or long-term damage in the heavy selling that took $SPX down from 1327 to 1245. We would expect to see that level retested, if not broken. Whether that happens immediately or a few weeks down the road, could depend on how the equity-only put-call ratios unfold. Right now, the market is no longer oversold, so anyone who bought on that basis should be lightening up and tightening stops.
Lawrence G. McMillan is the author of two best selling books on options, including Options as a Strategic Investment, recognized as essential resources for any serious option trader's library.