Yesterday's rally produced several noteworthy developments, although it must be said that the overall volume was subdued as the markets wait for today's release of the May employment data. The Nasdaq 100 (^NDX) came to life yesterday with one of its best performances of late as it moved up 2.3%. The volume on the QQQQ proxy however was less than the 15 day SMA, and the MFI chart for the proxy is not revealing any obvious suggestions of accumulation. There was evidence of some short covering in the constituents of the index and in view of the impending release of data we would still take a wait and see approach before taking long exposure in the big tech names.

The S&P 500 had a strong session as it moved up 1.2% and, most notably, managed to close decisively above the 1280 level. As we have indicated on the chart below there is another key hurdle to be crossed which is the 200 day EMA at 1288 and there is further potential resistance points on the chart in the vicinity of 1290.

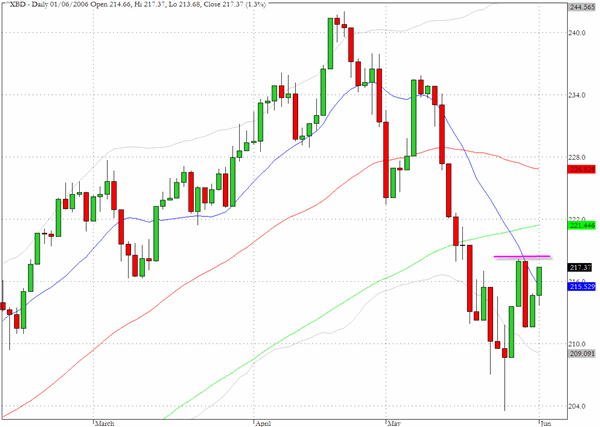
The broker/dealer sector index (^XBD) was one of the first major sectors to show weakness prior to the recent market sell-off and is not showing too much enthusiasm as it tries to mount a rally. Yesterday√Ę‚,¨‚"Ęs close was lower than the close on May 26th and in reviewing some of the individual stocks there are some that are still showing signs of weakness.
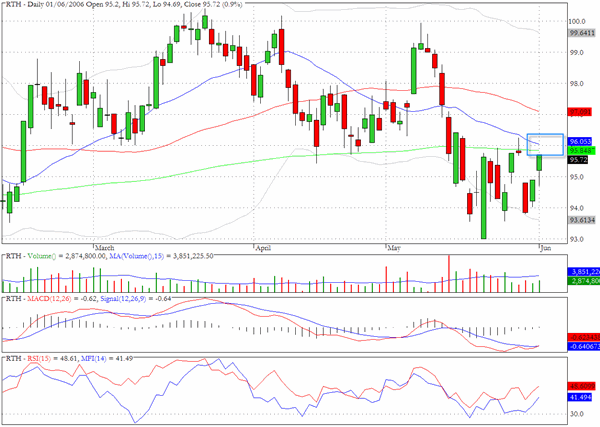
Several retailers are showing some evidence of basing and accumulation but the retail sector fund, RTH, may be approaching an area of potential chart resistance as the intersection of the 50 and 200 day EMA's sits just above yesterday's close.
TRADE OPPORTUNITIES/SETUPS FOR FRIDAY JUNE 2, 2006
The patterns identified below should be considered as indicative of eventual price direction in forthcoming trading sessions. None of these setups should be seen as specifically opportune for the current trading session.
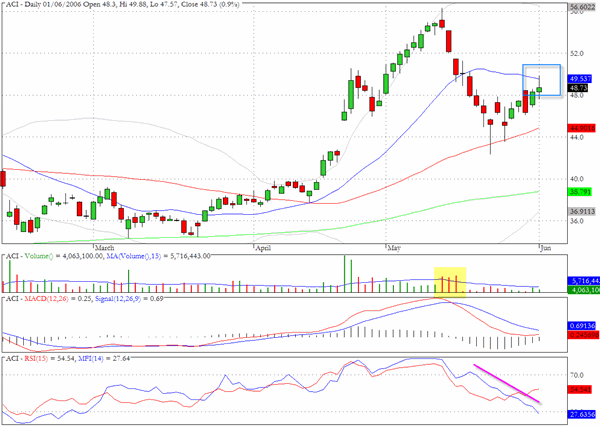
Arch Coal (ACI) has shown very modest volume since its recent decline and is now poised at the 20 day EMA and could be vulnerable to renewed weakness.
Amongst the investment banks, Bear Stearns has rallied back to a pivotal chart level on subdued volume. It may try to reach the 50 day EMA which was another two dollars above yesterday's close but could also be subject to further selling pressure if the recovery in the sector falters as the ^XBD chart seems to suggest.

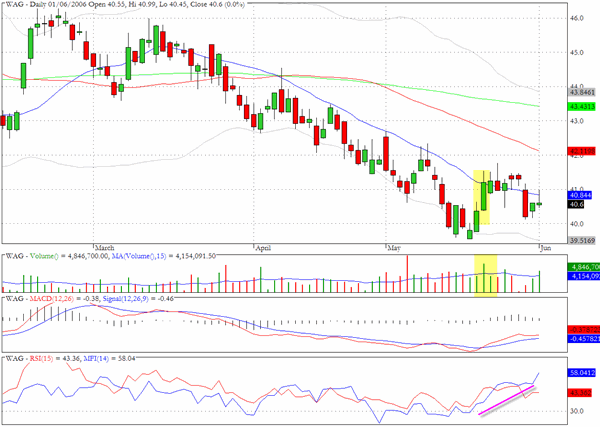
Walgreen (WAG) has a positive money flow chart and the price action suggests that we should see a move up towards the 50 day EMA in coming sessions.
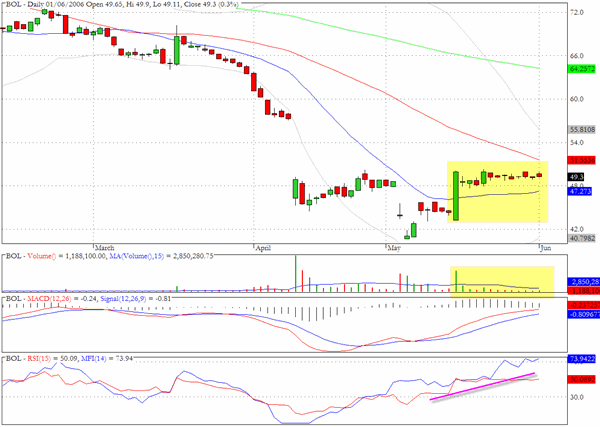
The chart for Bausch and Lomb intrigues us as the slope to the MFI line is very positive but the price action shows an extended price congestion pattern which lies exactly at the price level following the severe gap down in early April. If the stock can break above the gap it could be headed towards the $60 level.
Clive Corcoran is the publisher of TradeWithForm.com, which provides daily analysis and commentary on the US stock market. He specializes in market neutral investing and and is currently working on a book about the benefits of trading with long/short strategies, which is scheduled for publication later this year.
Disclaimer
The purpose of this article is to offer you the chance to review the trading methodology, risk reduction strategies and portfolio construction techniques described at tradewithform.com. There is no guarantee that the trading strategies advocated will be profitable. Moreover, there is a risk that following these strategies will lead to loss of capital. Past results are no guarante of future results. Trading stocks and CFD's can yield large rewards, but also has large potential risks. Trading with leverage can be especially risky. You should be fully aware of the risks of trading in the capital markets. You are strongly advised not to trade with capital you cannot afford to lose. This article is neither a solicitation nor an offer to buy or sell securities.