NASDAQ Commentary
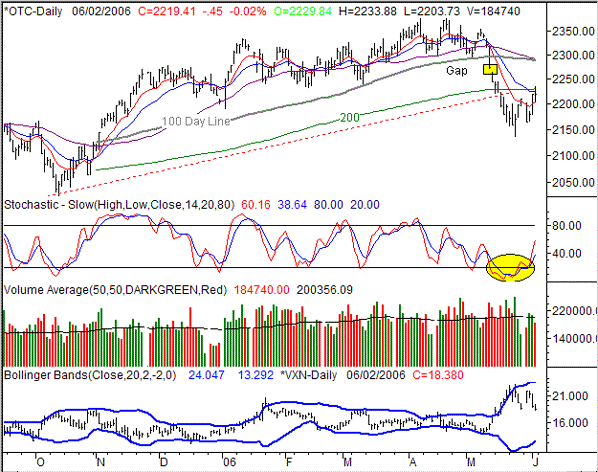
The NASDAQ rallied by 0.41% last week, gaining 9.04 points to close at 2219.41 on Friday. Not only was that well off the pace set in the previous week, it wasn't even the top-performing index. Then again, it was only a four day week, so there wasn't quite as much time to make as big of a gain. But the big question is whether or not the past two weeks worth of bullishness is the beginning of a bigger upward move. Some analysts think it is; we're not so sure. The fact of the matter is that the NASDAQ is just now starting to hit some key resistance lines.
We've seen it all year long - the NASDAQ's zig-zag pattern. No trend has really been sustained for more than a few weeks (if that). So, we weren't totally surprised to see a couple of weeks worth of upside after the composite got crushed in mid-May. That's an important idea to keep in mind, as we explain that the last couple of weeks is far from being a sign of bullishness. Just for some perspective, the NASDAQ is almost still underwater for the year (and would still be in the red, were it not for a decent buying effort late last week). It's also still 155 points under its recent peak highs. Oh yeah, it's also still under the 20 day line, the 50 day line, the 100 day line, and the 200 day line,
So for the bulls, we'll caution this......the 20 day line at 2225, and the 200 day line at 2230, were both resistance lines on Friday. For there to be any hope of more upside movement, those hurdles have to be crossed first. Even if they are, the 50 day and 100 day lines are both at 2288 right now. We have little doubt that both of those will act as resistance as well. The point is, there are several roadblocks ahead....some are very close, and some are about 70 points away.
This scenario is made even more interesting by the fact that the falling NASDAQ Volatility Index (VXN) still has plenty of room to fall. It closed at 18.38 on Friday, while the lower band is only at 13.13. That's a lot of room and time before a reversal for the VXN is forced. Specifically, that may be enough time and room for the composite to actually climb past the 2230 level and retest the 50/100 day lines at 2288. After that, we stil have our doubts about the bullish possibilities, but the 70 point move wouldn't be a complete shock. That said, that possibility is irrelevant if the NASDAQ can't make it above 2230.
In the meantime, the composite is still vulnerable. If we see another close under the 10 day line at 2203, another big wave of selling is a distinct possibility.
NASDAQ Chart

S&P 500 Commentary
The S&P 500 was the top-performing index last week, gaining 0.63%. The close at 1288.20 was 8.05 points above the prior Friday's close. Being the second positive week in a row, it would be easy to get bullish based on the SPX chart. However, there's still at least one key resistance line that needs to be crossed....and it proved to be something of a problem on Friday.
The problem the bulls encountered on Friday was the 100 day moving average line. We don't usually even look at this one, but it became important over the last few months. In mid-April, it acted as a support line, sending the S&P 500 back up to new multi-year highs when it was encountered at 1280.75. We thought it may become an even more important support line when it halted the major decline for a few days in mid-May. But when it finally did break down on May 17th, it was like the flood gates were opened - the SPX fell 22 points on May 17th. Now to see it halt the upward advance on Friday again leads us to believe it's a make-or-break line. So, unless the S&P 500 can actually get above the 100 day line at 1289, the bulls shouldn't get too excited.
On the flipside, the bullish momentum is good, and the CBOE Volatility Index (VIX) still has plenty of room to move lower. Plus, we're still not stochastically overbought, so the selling (i.e. profit-taking) pressure isn't overwhelming yet.
Focusing in on the VIX, the peak at 19.87, then the move back inside its band lines, was indeed a short-term bottom. Since then, it's moved lower to close at 14.32 on Friday. The thing is, the lower band is only at 10.43, which leaves plenty of room for it to keep moving lower before the reversal pressures really kick in. In that sense, the bulls should be happy to see the kind of bullish potential this chart may have. However, it still all hinges on the 100 day line.
S&P 500 Chart

Dow Jones Industrial Average Commentary
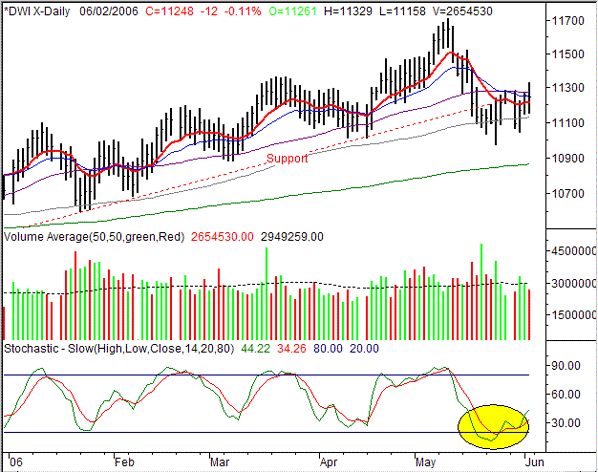
The Dow's close at 11,248 on Friday was 31 points lower than the prior week's close, locking in a 0.27% loss for the shortened week. It was the only index to take a loss for the week, after it saw the biggest gain the week before.
But despite the loss, the Dow's chart remains the most impressive of the three. The 100 day line actually held as support here, and the blue-chip index is within striking distance of the 20 and 50 day lines. In fact, on an intra-day basis, the Dow traded above both of those moving averages on Friday.
As with the NASDAQ and the S&P 500, we really need to see a couple of closes above 11,275 to really get bullish. But on a relative basis, we still see the Dow as the safest (and least volatile) place to be.
Dow Jones Industrial Average Chart

Price Headley is the founder and chief analyst of BigTrends.com.