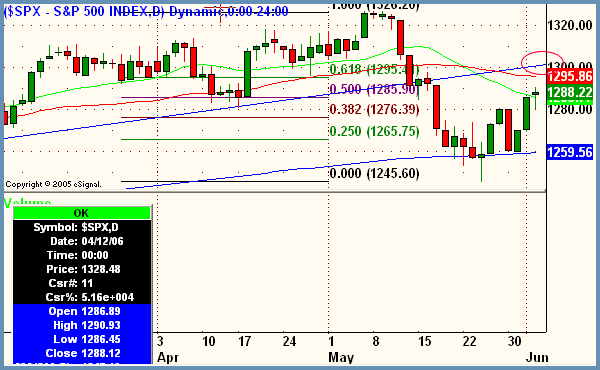
Good Morning, Traders. Let's run down Friday trading together and then into the bigger picture. It was a relatively flat day on the third day up for the S&P. All three major averages closed near to their respective "zero lines," which is Thursday's close. The Dow and Nasdaq Composite were down a hair and the S&P was ahead by the same. ShadowTrader Core Sector List split pretty much 50/50 with some strength in Gold miners and Oils and weakness in Homebuilders and Internets. That's a very abridged version of what happened on Friday, but this is the Big Picture, so let's see how Friday's action fits into the overall market scenario currently in play. The daily S&P chart below shows a Fibonacci retracement analysis from the highs of May 8 to the lows set on May 24. The circled area in red is where we should be focusing our attention in the coming week. There are two very important pivots happening there. The first is the blue diagonal line that ends close to 1300. This is the bottom of the trend channel in the S&P that has been violated during the course of this major selloff. As we have discussed often in this space, trendlines violated to the downside often act as resistance points when tested from the beneath. The second pivot is the 61.8% Fibonacci retracement which is at 1295.41. I'm of the opinion that this confluence of two techinical indications in the same area strengthens the odds of a reversal in the broad markets to the downside. This area will more than likely be tested this coming week.

Peter Reznicek is the Chief Equity Strategist and a principal of the Prana Fund, a domestic hedge fund, and ShadowTrader, a subsidiary of thinkorswim which provides coaching and education to its clients on both intraday and swing trading of equities. For a free trial to the full version of The Big Picture or to learn about ShadowTrader's other services, visit shadowtrader.net or send an email to preznicek@shadowtrader.net.