The US equity markets spent much time this week stabilizing the strong declines in May. As I write, the market is now well on its way into a big and sustainable bounce. All in all, the markets produced a hefty intermediate-term degree correction, that in its first wave, produced a 12% correction in the Nasdaq, and approximately 6% a piece for the S&P 500 and Dow. Of the three major measures, it was the Dow that held-up the strongest, and as the numbers clearly show, the Nasdaq is the weakest link. This should not be a surprise, as the long-term charts on these markets make no argument that the Nasdaq is still very ill from its 84% "crash" early in the decade.
For now, the markets are attempting to stabilize and measure the strength of bids so as to determine whether there is enough buying volume to recover to new highs. But first, we treat the current short-term action as a bounce only, and will have to measure the retracement accordingly. Basic support and resistance combined with Fib measurements on the short-term level are going to play a critical role in the days ahead, so let's take a look, starting with the S&P 500:

Chart Notations:
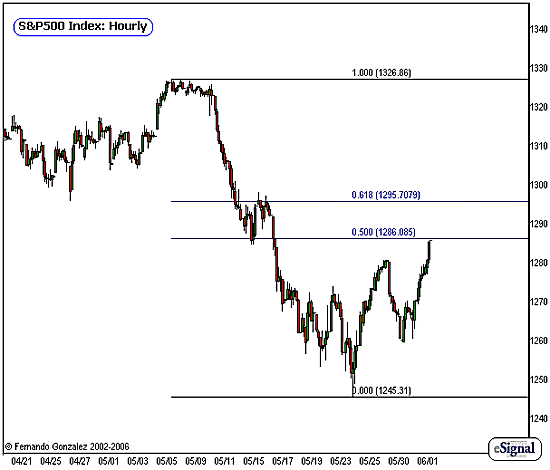
The hourly chart of the S&P 500 going back to late April addresses the short-term market
Here we see the clear structure of the decline in May based on hourly bars. We also see the shape of the current attempt to recover.
The bounce has brought the S&P 500 straight into the 50% retracement mark. This also happens to coincide with a critical low point in May. This is former support, now serves as resistance that we can cross-reference to the 50% mark.
Time-wise, however, the bounce is carrying plenty of momentum, and this upward correction does not appear to be over just yet. We should not be surprised for the market to exceed the 50% mark and move towards the 62% Fib retracement area.
We shall treat the area between the 50% and 62% retracement marks as a "Neutral Zone" taking the bearish posture only if the market is trading below the 50% mark, and the bullish posture above 62%.
Note also that the Nasdaq, discussed below, still has more room to bounce, next:

Chart Notations:
The daily chart of the Nasdaq-100 above supplements our earlier S&P 500 chart and addresses the short-term time frame
As mentioned, the Nasdaq still has some technical room (both time and price-wise) to move upwards in the attempt to recover from the sell-off.
In the days ahead, as long as the market is trading in positive territory, we shall look for the Nasdaq to make its way towards the 38% Fib retracement as marked, which we also can cross reference to former support points (blue dots). Let's look for the bears to resume their challenge there.
Fernando Gonzalez is in his 10th year as an active trader, technical analyst and content contributor to the active trading community and a long list of popular financial media. Online Trading Academy trading knowledge...your most valuable form of capital.