With the market still in turmoil, we thought it would be interesting to take a look at which sectors were emerging as leaders and laggards. So, we don't have a single industry to spotlight today. We do, however, have a handful of sectors worth a closer look.
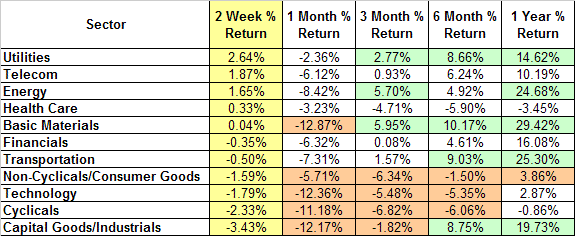
How are things shaping up? It's been an interesting month. The energy and basic materials stocks that had been on fire for months have taken some of the worst hits in the last few days. Both have stabilized, but neither have come anywhere close to resuming their top standing they claimed just a few months ago. Despite the fact that Bernanke is hawkish on inflation, these sectors are clearly not as compelling as they have been.
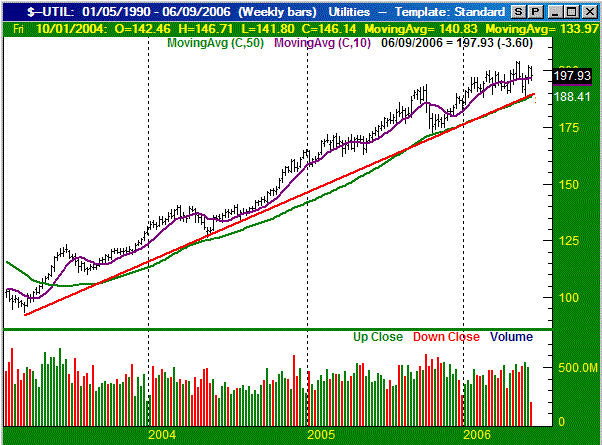
The strongest area over the last two weeks? Utilities. No, that's no typo - the utilities sector has fared the best recently, actually managing to move a little higher despite the overall market weakness. This same sector gets some bonus points for consistency too. Telecom gets a nod too - it was second in terms of performance, as well as consistency.
Utilities Sector (S&P Index) - Weekly

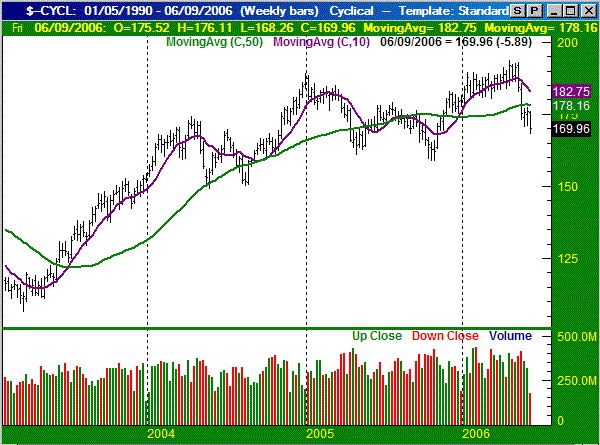
Recently, the weakest links have been capital goods and the cyclicals. The weak cyclicals aren't a total surprise - they've been at or near the bottom of the pile in every possible timeframe so far this year, so why would that change now? The recent plunge was just a death blow, so to speak, pulling the index well under its 200 day moving average (green). The weakness in the capital goods is a bit of a surprise, as they were one of the key leaders in the early part of the last twelve months.
Cyclical Sector (S&P Index) - Weekly

By the way, technology has been one of the most consistently poor performers for a year now. Yet, we'd still contend that the sector offers individual equities that have tremendous upside potential. Likewise, there's plenty of downside potential, not just in certain stocks, but in the overall sector as well. Pick and choose your individual tech names carefully, and with respect to the specific industry (software, hardware, internet, etc.).
The total results summary is below. Note that this grid is not one-dimensional. Sometimes the sectors that have been leading for too long are poised for a pullback. Conversely, if a sector has been underwater for a while, it may be due for a bounce. Or, as always, a trend may continue indefinitely. That's why this relative ranking system is best used in conjunction with individual sector charts. This is especially true for those looking for sector rotation.
Sector Performance Rank, Sorted By Two-Week Return

Price Headley is the founder and chief analyst of BigTrends.com.