NASDAQ Commentary
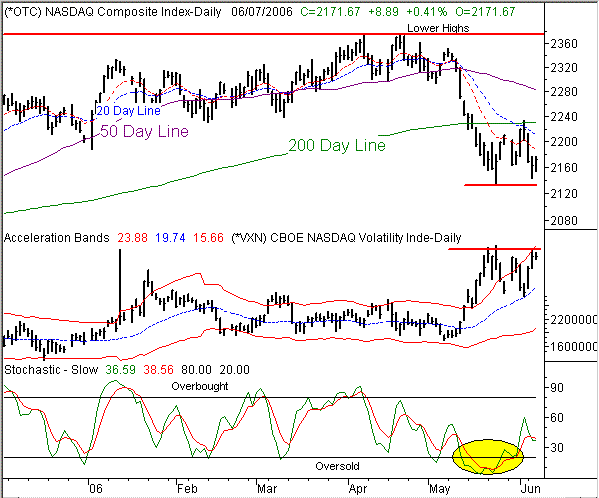
Despite the fact that the NASDAQ Composite is up by 8.89 points (+0.41%) for the day, there's still a bigger problem looming. Specifically, the 200 day moving average was verified as a resistance point when it was briefly touched on Friday, before the composite fell back to close five points under it to end last week. It wasn't until this week, however, when that became clear. As of right now, the NASDAQ's trading level of 2171.67 is more than 58 points under the 200 day average line. And for the week, the index is in the hole by 47.74 points (-2.15%). There's not much bullish about that.
With the NASDAQ back under all of its key moving average lines, it's hard to be anything but bearish. We saw a couple of potential upside catalysts. including being stochastically oversold. However, that stochastic buy signal from June 1st has already been undone, with the %K line (green) falling back under the %D line (red) as of today.
In our last MidWeek Update, we also pointed out that the NASDAQ's Volatility Index (VXN) was pulling back from a sharp move up to a high of 23.55. As long as it was headed lower, stocks could continue to head higher. But look what happened - the VXN's 10 day moving average line stopped the downtrend cold, and sent the VXN almost back to where it was. And this time, it wasn't a violent move that's setting up a quick pullback. Instead, the VXN has now developed a full-blown uptrend.
Unfortunately, our outlook really isn't any less neutral than it was before. The composite remains stuck between some support and resistance lines, and is pretty much where it was in the middle of last month. As such, we're still in a wait and see mode here. Only a break above the 200 day line at 2230 would get us bullish, but we wouldn't worry unless the NASDAQ broke under support at 2135. That was the low for the year, reached in late May. At the same time, we'll be looking at the VXN for signs of the same two scenarios. If the VXN breaks past its recent peak at 23.55, that too may signal another bearish leg for stocks.
NASDAQ Chart

S&P 500 Commentary
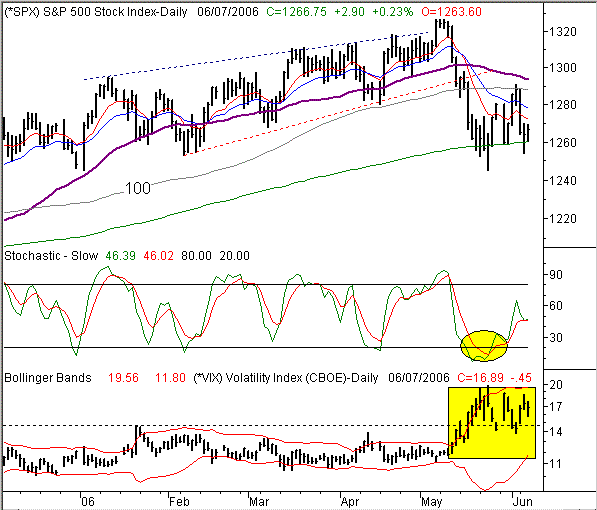
Although the S&P 500 has managed to hang above its 200 day line, it's not like it's not without its own problems. In this case, the 100 day moving average at 1288 is the barrier. That line was tested on Friday when the SPX got up to 1290.70, but the market made a complete reversal on Monday to get back to levels we saw in mid-May. Yet, the 200 day line has never wavered as support, ending two precipitous drops in a rather abrupt manner. So like the NASDAQ, the SPX is tucked away in a narrow range.
Overall, we'd have to say the bears are still in control here, but barely. With the exception of the 200 day line, the S&P 500 is under all of its other key moving averages. In fact, the 10 and 20 day lines are also now under the 100 day line, while the 50 day line isn't too far behind. So, there's clearly a shift in the bigger-picture momentum we had started to enjoy over the prior six months.
We thought that upward momentum might be resumed a week and a half ago, when the SPX chart stabilized, and the CBOE S&P Volatility Index (VIX) started to pull back from a high of 19.87. In fact, the VIX dip to 14.26 on May 26th was supposed to be a signal that it was headed lower again, with plenty of room until the floor was hit. But look what happened since then....the VIX has just been bouncing around between 14.0 and 18.5, with little or no direction. Likewise, the market didn't really move much either. That in itself is not a big deal. The big deal is that the listless drift allowed the VIX's lower Bollinger Band ('the floor') enough time to move from 9.4 to 11.6. Point being, the potential plunge for the VIX just shrank by more than two points. In many respects, it's a coincidental sign that any bounce opportunity the SPX had has also weakened. It could still happen, but the snap-back rally is just unlikely.
That said, we're watching the VIX even more closely than the S&P 500 chart right now. If it hits a new high above 19.87, that should be bearish for stocks. If it finally gets under 14.0, that's a bullish hint. Support and resistance for the actual SPX Index is at 1254 and 1288, respectively.
For the day, the S&P 500 is up 2.90 points (+0.23%). For the week, it's down 21.45 points (-1.67%).
S&P 500 Chart

Dow Jones Industrial Average Commentary
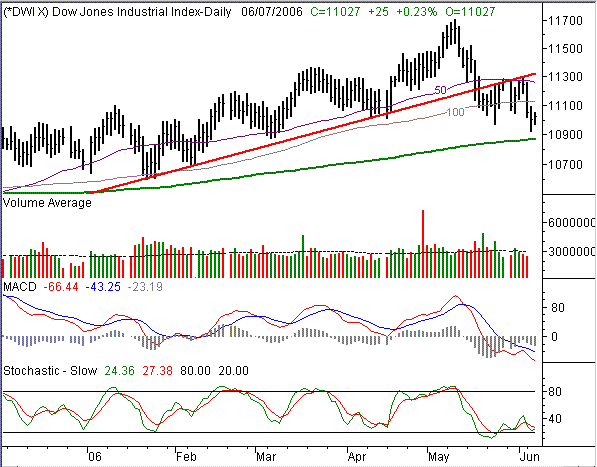
The Dow's 25 point gain today (+0.23%) leaves it at 11,027. That's still in the red by 221 points (-1.96%) for the week though. And truth be told, the Dow's chart looks like it has the most to lose of the three we normally look at.
We had been using the 100 day line as a support level for the Dow Jones Industrial Average. Why? It had been proven as support multiple times in the last few months. That is, until Monday. The 200 point selloff pulled the blue-chip index decisively under the 100 day average line at 11,130. It hasn't been challenged since then (of course, it's only been two days).
From an unbiased perspective, the selling has come easily and frequently, while the rallies have been muted and mild. And on a more subtle but more bearish note, take a look at the NACD lines. Not only have we been under the same sell signal since mid-May (an accurate signal, by the way), but the MACD lines are now under zero. In general, that's an added sign of weakness.
But still, we're not going to assume that anything is radically different for the Dow when compared to the SPX and the NASDAQ. Support is at the 200 day line, or 10,872, while resistance is now at the 100 day line, or 11,130
Dow Jones Industrial Average Chart

Price Headley is the founder and chief analyst of BigTrends.com.