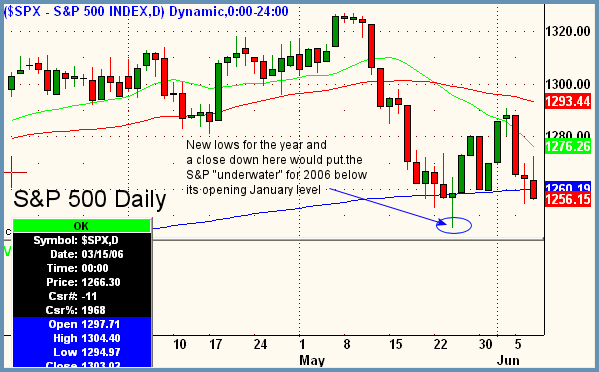
Good Morning, Traders. It was a fourth day in a row downward, which brought the Dow to sub-11,000 for the first time since early March. Whatever you think the catalyst is, the Fed, inflation, earnings, dowgrades or high oil, the fact remains that bulls simply cannot get a foothold as of late. The chart below of the daily S&P shows multiple tests of the 200ma (blue) and an increasing number of days closing at the low end of the range since the May 24 bottom. Additionally, the S&P is now in danger of closing a weekly bar below 1249.37, which is our opening level of 2006. Remember that an S&P benchmark index that is down for the year will have negative psychological impact on investors and may bring in more sellers to add insult to injury. Near-term bias is sideways to down and overall bias is slowly shifting to sideways to down. The summer does not look promising at this juncture for the bulls.
Focus List Stocks
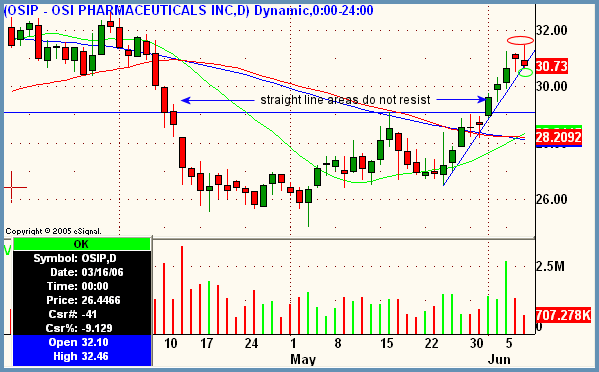
OSIP - OSI Pharmaceuticals Incorporated
Industry - Biotechnology
Side - Short
Trigger - 30.52
Stop - 31.55
Target - 29.00
Timeframe - 3 days to 1 week
Notes
- OSIP has had quite a run since late May and is now threatening to break the trendline of that advance.
- Topping tail at a resistant area indicates a retracement from this level.
- Straight line areas of advance and decline do not resist or support when prices move back through them.
- Target is to retrace back to prior swing highs of May.
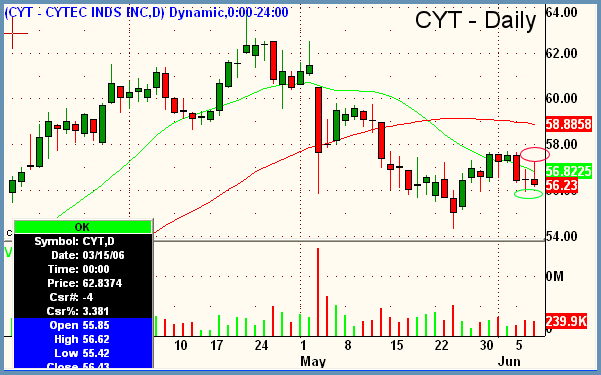
CYT - Cytec Industries, Inc.
Industry - Chemicals
Side - Short
Trigger - 55.79
Stop - 57.34
Target - 53.00-
Timeframe - 3 days to multiweek
Notes
- Rollover from prior bullish pattern.
- Now underneath key moving averages of 20 and 50 day.
- Target to retest prior swing lows but should move lower.
- Recent analyst downgrades of this sector as its very correlated with market and economy.
- Target is to break swing lows of May 24, which stock should do if S&P loses the same low.
Peter Reznicek is the Chief Equity Strategist and a principal of the Prana Fund, a domestic hedge fund, and ShadowTrader, a subsidiary of thinkorswim which provides coaching and education to its clients on both intraday and swing trading of equities. For a free trial to the full version of The Big Picture or to learn about ShadowTrader's other services, visit shadowtrader.net or send an email to preznicek@shadowtrader.net.


 Free Festival of Traders Videos