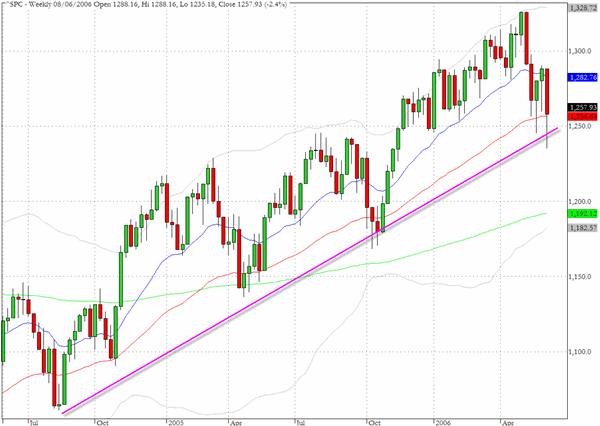
In yesterday's heavy volume trading session, some critical levels were tested and the big reversals suggest that some decision makers may have decided that the recent severe weakness has, at least temporarily, run its course. Perhaps the key level that seems to have brought out the buyers (or profit taking from the short sellers) is seen on the weekly chart for the S&P 500 below.
A violation of the 1240 level would have broken a two-year trend line through the lows and it seems that, on balance, traders decided to respect the significance of this support line. As the index dropped below 1240 in midday trading some clear evidence of buying appeared. The low for the day was 1235 but the index managed to close at 1257 and not too far adrift from the 200 day EMA which lies at 1263. A re-test of 1240 is to be expected and if this can hold a second time we may have found a tradeable plateau in the near term.
I will be taking a short break and will resume publication on Tuesday, June 20.
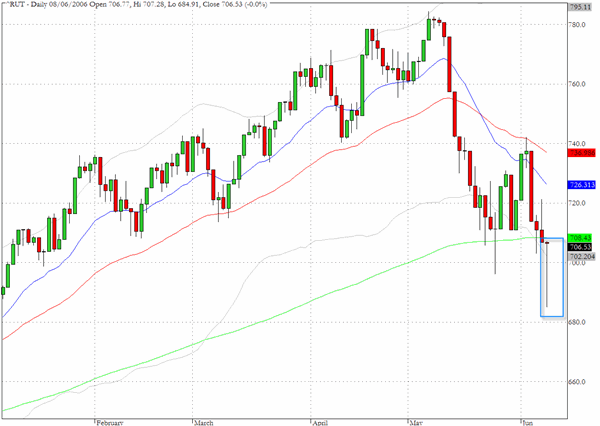
The daily chart for the Russell 2000 (^RUT) reveals an unusual and striking formation with a tiny body to the candlestick and a very long lower tail. The index began the session very close to the 200 day EMA and ended the session at the same level but in between the index dropped almost 3% and came within four points of the pivotal 680 level. While the steepness of the recent correction raises a serious question mark about the ability of the small caps to continue to provide any market leadership, if this index can remain above 680 we may see a re-building effort that could still surprise some commentators who have thrown in the towel on the three year bull market.
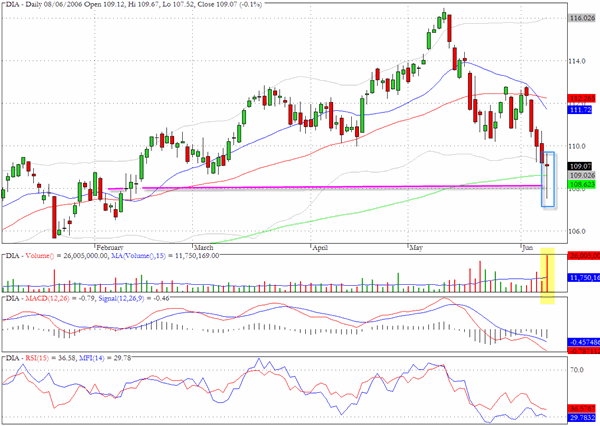
DIA, the proxy for The Dow Jones Industrials, recorded a very heavy volume session with volume at 2.5 times its recent average volume. The index also appears to have found support at its 200 day EMA (10860 on the cash index) but there are also lows around 10600 from January that may require attention before there is a sustainable relief rally.
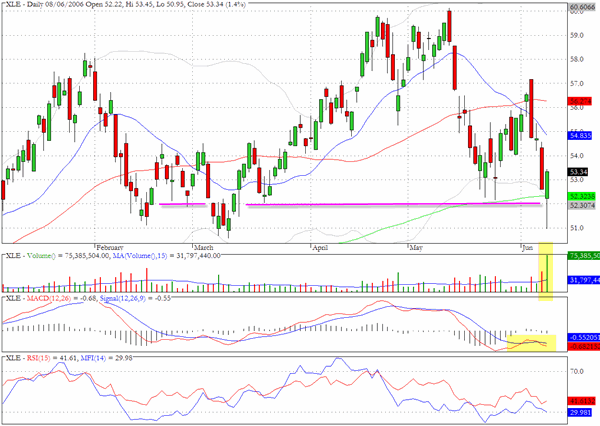
XLE, the energy sector fund, also appears to have found support at its 200 period moving average in yesterday's trading and the volume was also 2.5 times the 15 day SMA.
TRADE OPPORTUNITIES/SETUPS FOR FRIDAY JUNE 9, 2006
The patterns identified below should be considered as indicative of eventual price direction in forthcoming trading sessions. None of these setups should be seen as specifically opportune for the current trading session.
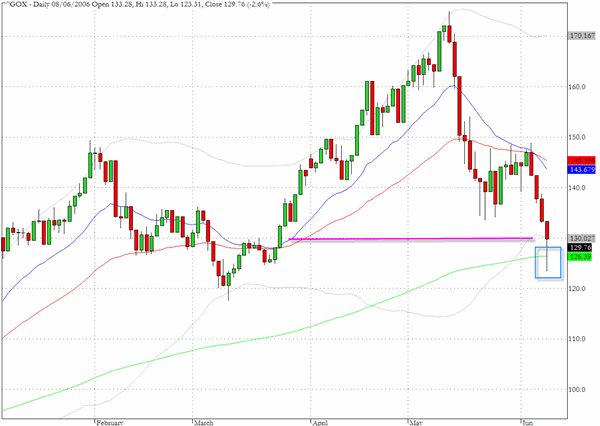
Apart from the broad market indices several other sectors also had critical sessions yeterday. The gold index (^GOX) has sold off very heavily since early May but has now approached an area of potential chart support.
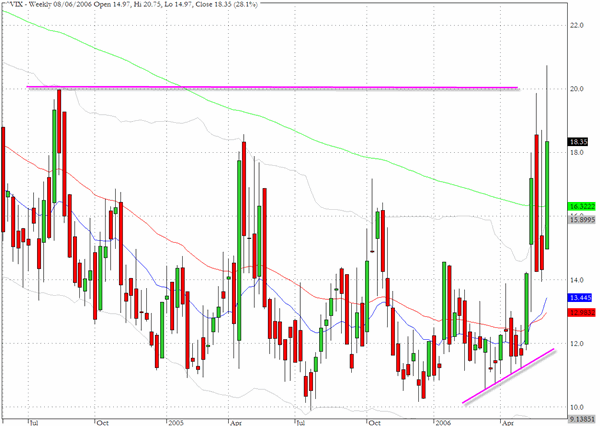
The weekly chart of the CBOE Volatility Index (^VIX) not only highlights the remarkable increase in the market's perception of risk over the last few weeks but also is suggesting that we should see much of 2004 and 2005 as a "trough" of relative tranquillity for the equity markets, somewhat similar to the mid 90's, and that we could be preparing again for more turbulent times.
Clive Corcoran is the publisher of TradeWithForm.com, which provides daily analysis and commentary on the US stock market. He specializes in market neutral investing and and is currently working on a book about the benefits of trading with long/short strategies, which is scheduled for publication later this year.
Disclaimer
The purpose of this article is to offer you the chance to review the trading methodology, risk reduction strategies and portfolio construction techniques described at tradewithform.com. There is no guarantee that the trading strategies advocated will be profitable. Moreover, there is a risk that following these strategies will lead to loss of capital. Past results are no guarante of future results. Trading stocks and CFD's can yield large rewards, but also has large potential risks. Trading with leverage can be especially risky. You should be fully aware of the risks of trading in the capital markets. You are strongly advised not to trade with capital you cannot afford to lose. This article is neither a solicitation nor an offer to buy or sell securities.