NASDAQ Commentary
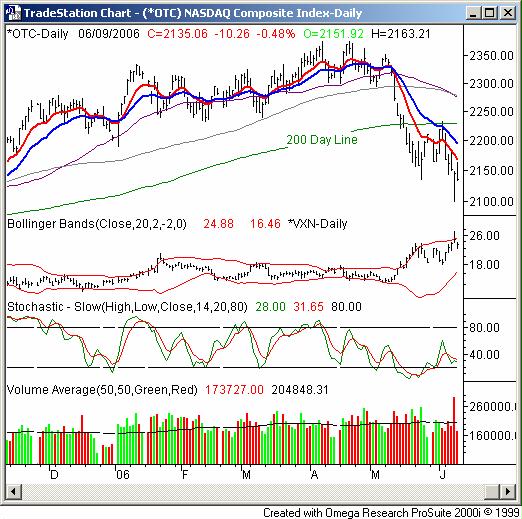
The NASDAQ Composite was the week's biggest loser, falling 84.35 points to close at 2135.06. That's a 3.8% plunge, which is just slightly smaller than the one taken in the week ending May 12th. Oh by the way....the index hit a new low for the year, and is in the red for the year by about 70 points.
The prior week had a glimmer of bullishness, as the NASDAQ was pointed higher (pretty sharply) on the 1st and 2nd of the month. This past week, though, the 200 day line and 20 day line acted as firm resistance, sending the composite back under the 10 day line....and to the lowest close of the year. And as many arguments that could be made for us to be at a bottom, the truth is the odds of a rebound aren't as good as you might think.
Why? Take look at the NASDAQ Volatility Index (VXN), for starters. The spike to 27.29 was above the 20 day Bollinger Band, with the close of 24.61 being back under that band line. That's a classic sign of an upside bounce, and for a while on Friday it look like it might happen. But by the end of Friday's session, it was clear the buyers still wanted no part of it. That's not exactly an encouraging sign for stocks, with the VXN still generally pushing higher. Plus, we're not stochastically oversold yet, so the pump is not quite fully primed.
So, we remain tentatively bearish. Obviously nothing is set in stone, but the selloffs come too easily while the rallies are tough to produce. With no catalyst in sight, the path of least resistance is lower. Stop on this bearish bias come with a close above the 20 day average, currently at 2195.
NASDAQ Chart

S&P 500 Commentary
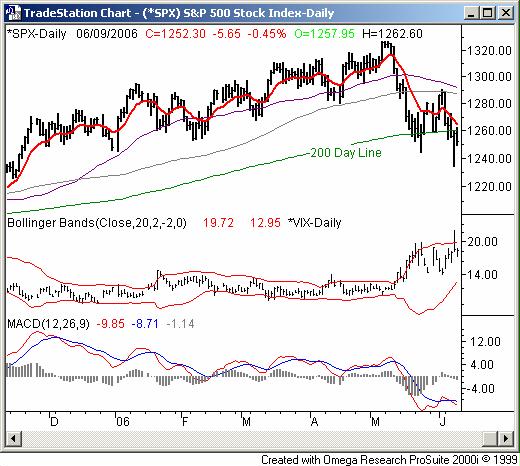
The S&P 500 gave up 2.79%, losing 35.90 points to close at 1252.30 on Friday. That was the best performance of all three major indices, although only in the sense that it was 'least worst'. The SPX also hit new lows for the year, but year-to-date, it's still in the black.....barely.
As each week passes, it seems like more and more technical damage is done. This week, the SPX closed under the 200 day moving average for the first time since October. The resistance at the 100 day line, currently at 1287, was what sent the index lower again on the 5th - the first day of the week. That move under the 200 day average wasn't the only sell signal though. We also have a new MACD crossunder sell signal. This one occurred under the 'zero' level. Those sub-zero sell signals are particularly meaningful because they indicate new short-term weakness within longer-term weakness.
And like the NASDAQ's VXN, the S&P 500 Volatility Index (VIX) hasn't really come tumbling down after a rapid move higher over the last few days. In fact, technically, the VIX is trending higher.
When you put all those pieces together, what you get is a bearish scenario. Like the NASDAQ though, keep a short leash on the outlook - things are a little more unpredictable than usual.
S&P 500 Chart

Dow Jones Industrial Average Commentary
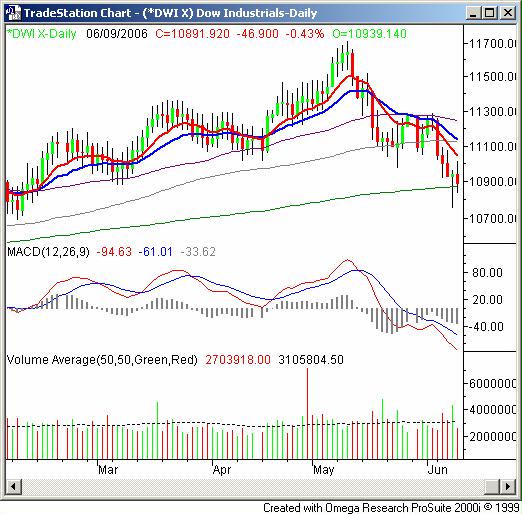
The index that had been holding up better than any other finally had a rough week of its own. The Dow Jones Industrials fell by 355.95 points to close at 10,891.92. That's a 3.16% selloff, yet this blue chip index is still in profitable territory for the year.
The Dow had held up the best of all the indices, but is really pushing its boundaries now. This last week, the 100 day line was toppled as support. That just leaves the 200 day line at 10,874 as support. However, the 200 day line is indeed acting as support - we saw the Dow trade under it on an intra-day basis on Thursday and Friday, but closed above it both days. On the other hand, there's some pretty strong bearish momentum in place now. (continued below)
Dow Jones Industrial Average Chart

Price Headley is the founder and chief analyst of BigTrends.com.