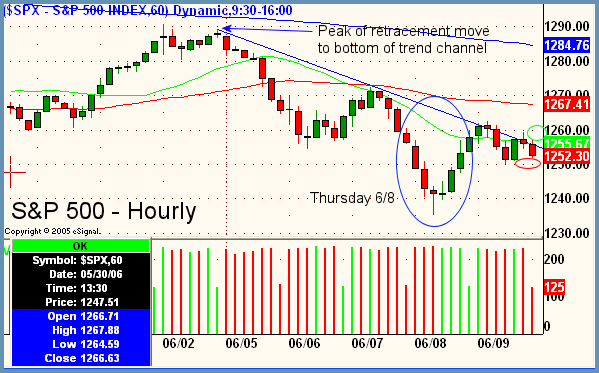
Good Morning, Traders. Relatively lackluster session on Friday that was flat all morning and then degeneraged into more weakness in the afternoon and close, pushing the Dow off 46.90, the S&P down 5.63, and the Nasdaq Composite less by 10.26. Many traders have been calling for a near-term bottom here. The blue diagonal line running from the center of the chart downwards is the trendline of the most recent down move from the top of the bounce that peaked on June 2. As we know, after this weak bounce the markets moved down with even greater force and made the new lows for the year in the circled area labeled Thursday, June 8. On this same day, the afternoon session retraced quite a bit and ran right back into the trendline resistance. Since then, we have just ground slightly lower, just under the trendline resistance. Therefore, going into today's trading, the two circled areas on the rightmost edge of the chart will be very key. A move by the S&P into the red area will more than likely indicate that the downtrend will stay intact and we move lower again, while a move somewhere above roughly 1261 will disappoint bears en masse and we will start to see some covering which could lift the markets this week. Overall bias remains downward as new lows for the year were set last week. Near-term bias is inconclusive unless either of the two aforementioned areas is breached.

Peter Reznicek is the Chief Equity Strategist and a principal of the Prana Fund, a domestic hedge fund, and ShadowTrader, a subsidiary of thinkorswim which provides coaching and education to its clients on both intraday and swing trading of equities. For a free trial to the full version of The Big Picture or to learn about ShadowTrader's other services, visit shadowtrader.net or send an email to preznicek@shadowtrader.net.