Good day! The Dow Jones Industrial Average barely managed to squeak by without another triple point loss on Monday, falling 99.34 points by the end of the session. The S&P 500 lost 15.90 points, while the Nasdaq Composite plummeted 43.74 points. Most of this selling came in the afternoon, although the day began on the weak side. After a very slight upside open, the indices broke down into 10:00 AM ET, creating a second wave of selling since Friday morning's highs.
Initial support hit as the Dow came into Friday's lows and the S&P 500 also retested prior pivot lows from intraday last week at the same time as the 10:15 ET reversal period hit. A slight correction on the 5 minute charts into the 5 minute 20 simple moving average was followed by a return to selling out of 11:00 ET. This allowed the indices to put in an equal move on the 15 minute charts as compared to the decline off Friday morning highs. That equal move support came shortly after 11:00 and by 11:30 ET the market was creating a 2B reversal pattern, bouncing off support into noon.
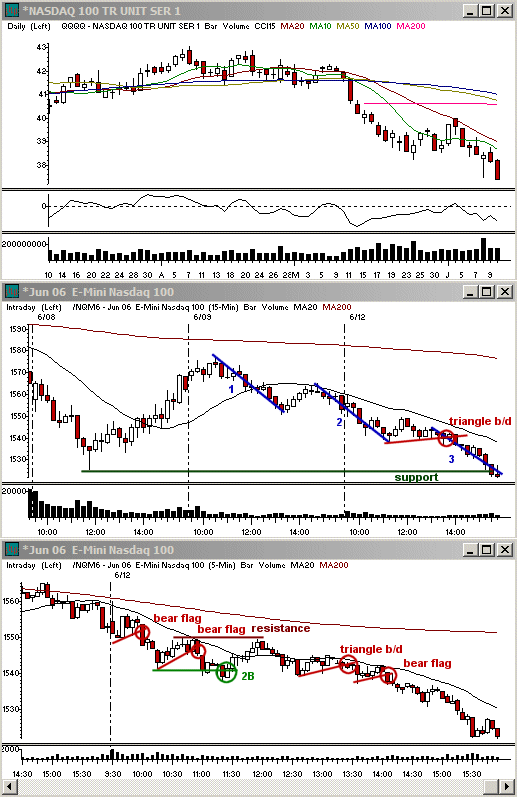
The 12:00 ET reversal period is a strong time zone in the market for intraday pivots. On Monday it helped stall the correction off support, as did prior 5 minute highs. It took a bit of time for the pace within the mid-day range to again turn back over in favor of the bears. This only became evident around 13:00 ET after the market began to hug the support zone from the day's lows with declining volume. This indicated a lack of buying despite the reaction to the support. By 13:30 ET the selling had hit once more and continued into the close, creating a third move lower on the 15 minute time frame since Thursday highs.
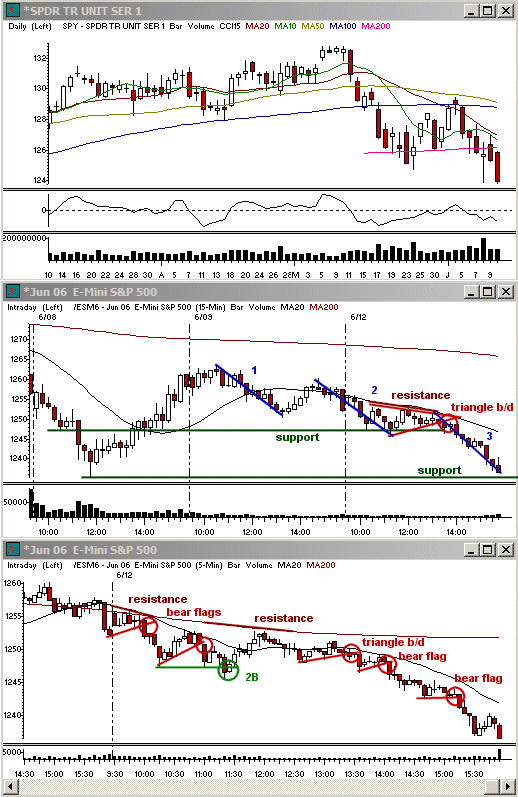
The market wasn't really able to show any reaction off late day support levels before the closing bell on Monday. Every level that hit on the smaller time frames only served as bear flag continuations. The third wave of selling on the 15 minute charts hit equal move support going into the last half hour of the day. It yielded very little reaction, despite the support from prior lows on the 15 minute Nasdaq Comp. and S&P 500.
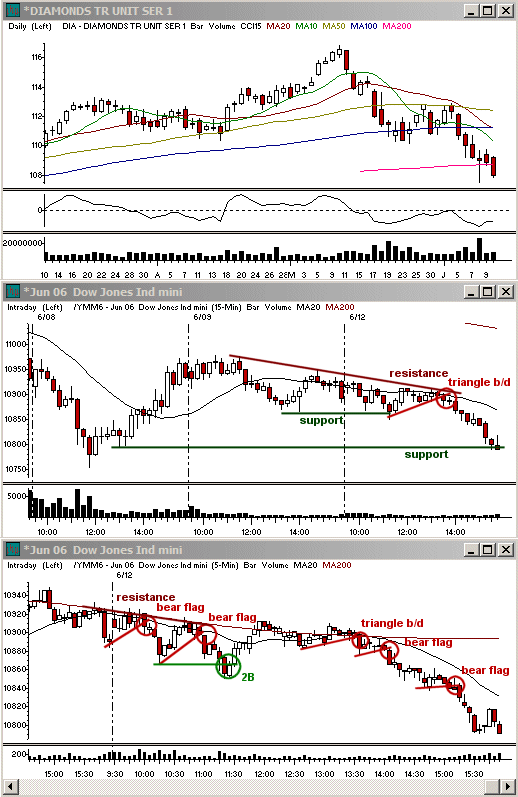
The selloff on Monday gave the market the start of that added flush we were looking for going into the day as a favorable attribute to allow for a better correction off support later on. Right now, however, the downside is still very strong. We generally will see a larger intraday correction after three waves of selling on the 15 minute charts whereby the 20 sma holds throughout. Nevertheless, there isn't anything yet to suggest a reversal on the larger time frames since the selling pace actually increased on the last wave of selling Monday afternoon, making it more difficult for any strong bullish action to take over. As such, corrective action is liable to get off to a slower start with rounded lows.
Economic Reports and Events
June 13: Business Inventories for April (8:30 AM); Core PPI, PPI, Retail Sales, and Retail Sales ex-auto for May (8:30 AM)
June 14: Core CPI and CPI for May (8:30 AM), Crude Inventories 6/10 (10:30 AM), Fed's Beige Book (2:00 PM)
June 15: 6/10 Initial Claims and NY Empire State Index for June (8:30 AM), Net Foreign Purchases for April (9:00 AM), Capacity Utilization and Industrial Production for May (9:15 AM), June Philadelphia Fed (12:00 PM)
June 16: Q1 Current Account (8:30 AM), Michigan Sentiment-Prel. for June (9:50 AM)
Earnings Announcements of Interest
Only stocks with an average daily volume of 500K+ are listed. List may not be complete so be sure to always check your stock's earnings date before holding a position overnight. (A) = Earnings after the close, (B) = Earnings before the open, (?) = Earnings time not specified at the time of this writing
June 13: BBY (B), GS (B)
June 14: CPST (?)
June 15: BSC (B), KBH (A), MBT (?), OVTI (?), PIR (B), PGR (?)
June 16: WGO (B)
Note: All economic numbers and earnings reports are in lines with those compiled by Yahoo Finance. Occasionally changes will occur that are made after the posting of this column.
Toni Hansen is President and Co-founder of the Bastiat Group, Inc., and runs the popular Trading From Main Street. She can be reached at Toni@tradingfrommainstreet.com.


 Free Festival of Traders Videos