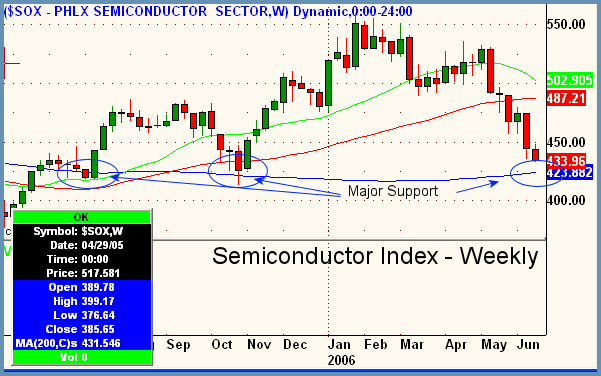
Good Morning, Traders. Another 90 points down on the Dow and the Nasdaq managed to record its eighth day in a row of losses. Incidentally, the Dow has now "joined the club" of being down for the year. Yesterday's decline closed the blue chip index below its opening 2006 level of 10,718. In doing so, declining volume outpaced advancing volume on the NYSE by over 5 to 1 and over 3 to 1 on the Nasdaq. Overall volume spiked hard, making Tuesday the fifth time this month that at least one of the exchanges recorded a distribution day. For the second day in a row, every single player on my sector list was red. Today it was broker-dealers and gold miners that took it most on the chin along with Coal and Natural Gas providers getting beat up. Crude closed on the NYMEX just under 68.50 per bbl. Decliners beat advancers by more than 1500 (bearish) on both exchanges. With all the selling going on, lots of traders are asking where and when will it all end, or at least temporarily. The answer may lie in the chart below. Regular readers of the column know that the $SOX is like a market internal indicator in itself and often leads the market. In intraday trading, it's often hard to ignite playable moves if the $SOX is not moving in the direction you anticipate. This holds true for the longer term as well. If we look at the weekly chart below, note the major support area that the semis are about to sell off into. This 200-period weekly moving average area has held the semis up twice so far in 2005 and should do so again here in mid-2006. This would also make sense in the near-term as selling today would be the ninth day of consecutive losses for the Nasdaq and markets tend to move in odd numbers. Would this 423 area ignite some sustained buying that will take the markets back up to prior highs? Well, as they say across the pond, "not bloody likely." However, given the tendency that the $SOX has to lead the markets, I am simply looking at this area as the first point to staunch some of the current bleeding. A bounce in semis at 423 will certainly lift the Nasdaq, which in turn will get at least some buying into the S&P. Overall bias remains firmly down, with near-term bias down as well.

Peter Reznicek is the Chief Equity Strategist and a principal of the Prana Fund, a domestic hedge fund, and ShadowTrader, a subsidiary of thinkorswim which provides coaching and education to its clients on both intraday and swing trading of equities. For a free trial to the full version of The Big Picture or to learn about ShadowTrader's other services, visit shadowtrader.net or send an email to preznicek@shadowtrader.net.