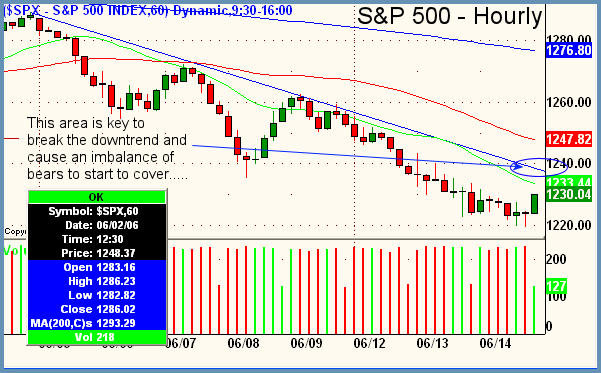
The number on the Dow that everyone is looking at certainly doesn't tell the story to those of us in the trenches. Dow up 110.78 in Wednesday's trade, with S&P collecting 6.35 to the plus side, and the Nasdaq snapping an eight-day losing streak by closing up 13.53. Choppy, sloppy day in the markets typical of reversal type days where the general direction was sideways. The Dow put on 89 points in the last hour and 15 minutes of trading to reach its 3-digit positive close number. The S&P and Nasdaq flatlined all day on either side of zero until late day trading. For the first time in a while, the majority of the core sector list closed green but unfortunately none of it was tech or financial, which is what we need to see if there is really going to be a turn here. Leading sectors were Natural Gas, Gold (mining), and Oil Services while Software, Semis, Banks, and Broker-Dealers (the sectors we need to be strong to really rally) brought up the rear. Additionally, of the three major averages that we follow, only the Dow closed at the high of the day, the S&P and Nasdaq were actually higher before noon than they were at the close. So, all in all a weak attempt so far at reversal, but some signs of buying are developing. The hourly S&P chart below shows just how long this downdraft has continued and where we need to pierce in order to snap it and bring some real demand into the picture. This area might not even get tested this week, because traders seem to be skittish ahead of options expiring this Friday. Be careful out there.

Peter Reznicek is the Chief Equity Strategist and a principal of the Prana Fund, a domestic hedge fund, and ShadowTrader, a subsidiary of thinkorswim which provides coaching and education to its clients on both intraday and swing trading of equities. For a free trial to the full version of The Big Picture or to learn about ShadowTrader's other services, visit shadowtrader.net or send an email to preznicek@shadowtrader.net.