NASDAQ Commentary
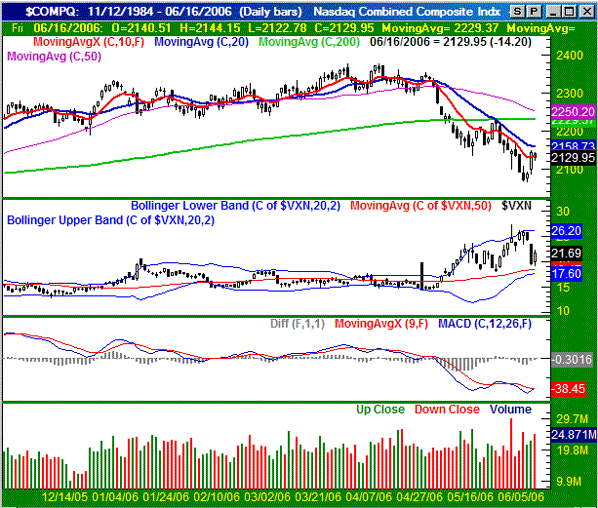
Despite Thursday's rally, the NASDAQ still ended the week slightly in the red. This week's close at 2129.95 was 5.11 points (-0.24%) lower than last Friday's closing level. And the close under the 10 day line doesn't exactly bode well for the coming week.
Although the latter half of last week's close was bullish, it was also to be expected. After all, the composite was oversold, and the NASDAQ Volatility Index (VXN) had just eased back from new multi-month highs. Our only goal today is to provide some perspective on the recent bounce, which some have viewed as evidence that we just hit the bottom. Maybe we did, but the charts still show more bearishness than bullishness.
For example, we still closed under the 10 day line on a weekly basis, and the volume has been decisively bearish. In fact, the bearish volume has been growing - see the bottom of the chart. With that in mind, we think there's still some bearishness that needs to play out. Note that we still have room for a little more upside before another significant leg lower. The 20 day line at 2158.73 is they key level to watch, given that it was the resistance line that sent the chart lower a couple of weeks ago. Only a close above that line would get us to a bullish expectation. Otherwise, we're looking for some more weakness...maybe even to the 2000 level.
NASDAQ Chart

S&P 500 Commentary
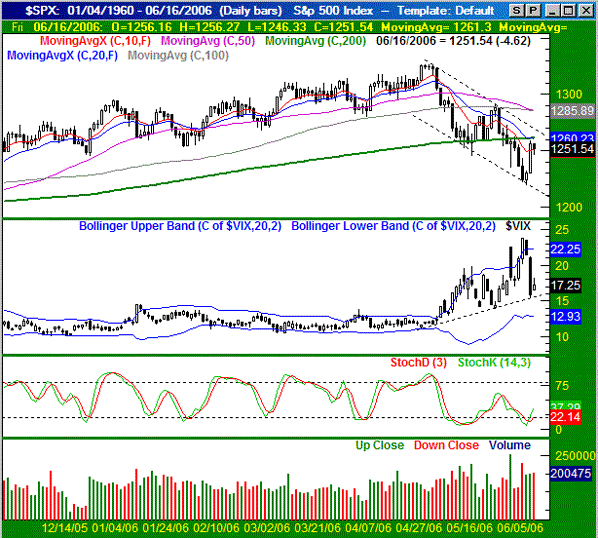
The S&P 500 came within a hair of breaking even for the week, closing just 0.75 points (-0.06%) lower than where we closed the prior week. For us, that's close enough to actually call a break-even, so we congratulate the bulls on a nice recovery effort. The SPX ended Friday's session at 1251.55. That's all well and good, but the large-cap index is still under that key 200 day moving average.
The S&P's story is the same as the NASDAQ's - Thursday's rally was nice, but not really enough to get the bullishness restarted. If anything, it was just a bounce within a bearish trading range. See the dashed lines on the chart below. We saw a similar bounce about three weeks ago, but it didn't break the bearish trend. In fact, the S&P 500 could move as high as 1265 and we'd still be in the downtrend. And with the 200 day moving average at 1260 (as is the 20 day line), there are just a lot of barriers that the SPX is going to have to struggle with. The path of least resistance is lower.
Plus, take a look at the CBOE Volatility Index (VIX). We saw a major plunge on Thursday that pulled the VIX all the way down to its 50 day moving average, which set the stage for a major upside reversal. With plenty of room to keep rising from Friday's close of 17.25 to the upper band line at 22.25, that also leaves a lot of room for stocks to fall.
Only a move above 1265 would get us to a bullish stance, and really, we'd want to see a close above the 50 and 100 day lines at 1286 to really be confident about being bullish. Our view is that the index will hit a headwind around 1260 and end up falling even under the previous low of 1219.
S&P 500 Chart

Dow Jones Industrial Average Commentary
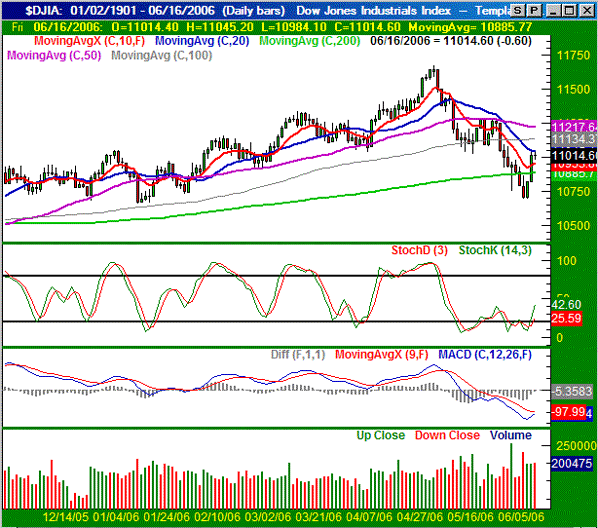
No surprises here - the Dow's relative strength during the downturn left it as the only index with a legitimate shot at a decent gain this week, which is exactly what happened. The close at 11,015 was 123 points higher (+1.13%) than last Friday's close. Plus, the blue chip index jumped back above its 200 day line. Still, though, the jury is still out.
Like the S&P 500, the 20 day line has been a resistance point lately for the Dow. And specifically, it capped the Dow's range on Thursday as well as Friday. With Wednesday's and Thursday's bounce only being on average volume, we can't get too bullish about it. After all, we were well oversold at the time.
There's also plenty of resistance lines besides the 20 day line (currently at 11,040). The 100 day line and the 50 day line are both slightly above current levels, and should help weigh the index down if the 20 day line can't do the job.
Dow Jones Industrial Average Chart

Price Headley is the founder and chief analyst of BigTrends.com.