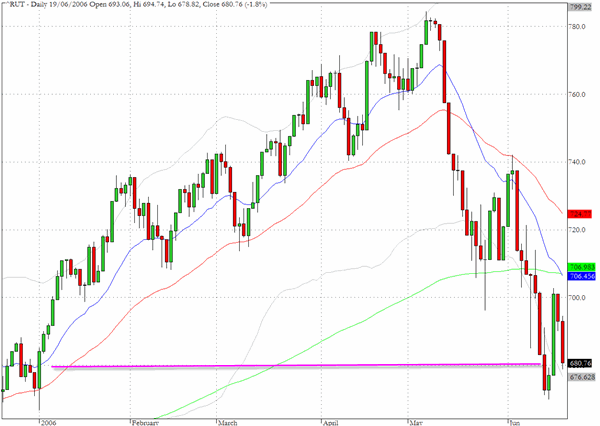
Returning from a break several charts have caught my attention. One of the most illuminating is for the Russell 2000 which closed yesterday with a 1.8% decline at the pivotal level of 680. The index is back to exactly where it began 2006 and is slightly more than 100 points below its all time closing high of 781 recorded on May 5.
We have commented previously that the 680 level is fairly critical for this index. We dropped just below it last week and bounced back so now we shall have to see how the re-test goes. If we should break down on the re-test then we would expect the next chart level to be tested would be last October's lows at 620.
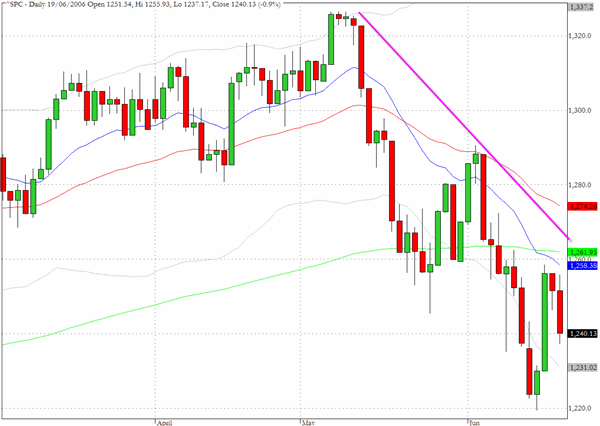
After the mid-week rallies from last week the S&P 500 extended its decline yesterday by almost one percent. This index is now below where it began 2006 and as the very steep trend line shows there could be real difficulty in moving back above the intersection of the 20 and 200 day EMA's in the vicinity of 1260.
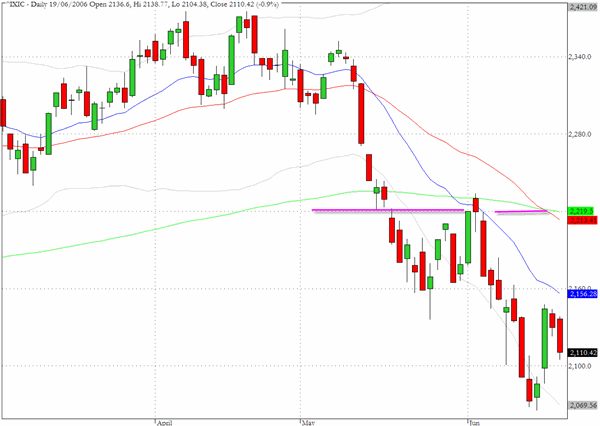
The chart for the Nasdaq Composite (^IXIC) is one of the starkest reminders of just how vicious the recent correction has been. The 2220 level, which is where the index began 2006 and which currently marks the convergence of the 50 and 200 day EMA√Ę‚,¨‚"Ęs now looks a very long way away even if the re-test of last week√Ę‚,¨‚"Ęs lows is successfully completed.
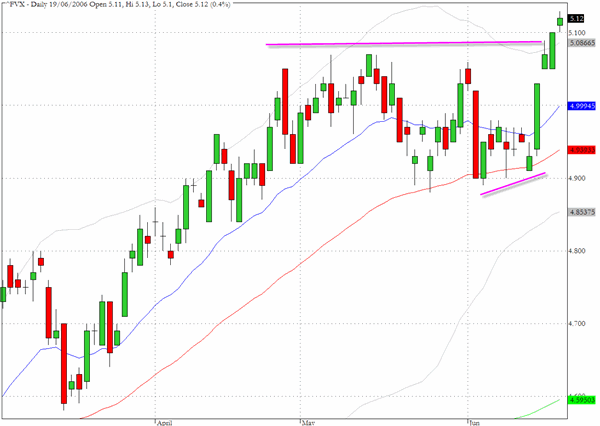
We have featured the yield on the five year Treasury note (^FVX) because yesterday it appears to have broken above its recent trading range and closed at 5.12%. One of the more notable developments that has taken place over the last few sessions is the resumption of the trend towards higher Treasury yields, and we shall be keeping a close watch on the ten year yield which closed at 5.14 yesterday and may be headed back towards the 5.2% lvel that it touched in May.
TRADE OPPORTUNITIES/SETUPS FOR TUESDAY JUNE 20, 2006
The patterns identified below should be considered as indicative of eventual price direction in forthcoming trading sessions. None of these setups should be seen as specifically opportune for the current trading session.
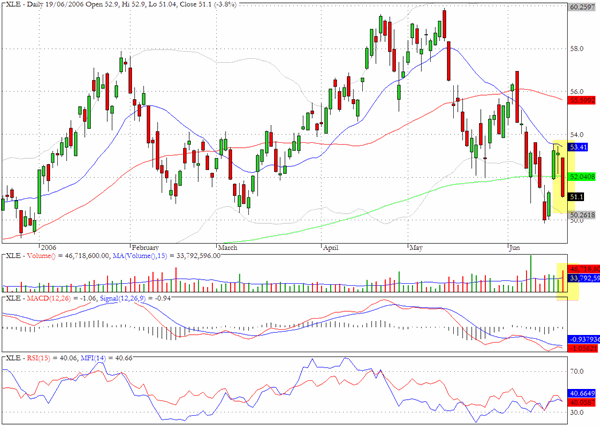
The energy sector was one of the major casualties yesterday and the chart below for XLE shows that we closed below the 200 day EMA on above average volume. Most of the worst performing stocks yesterday were from energy related sectors. ACI, BTU, EOG, RDC, SU and TLM all sustained five percent or greater losses in yesterday's trading.
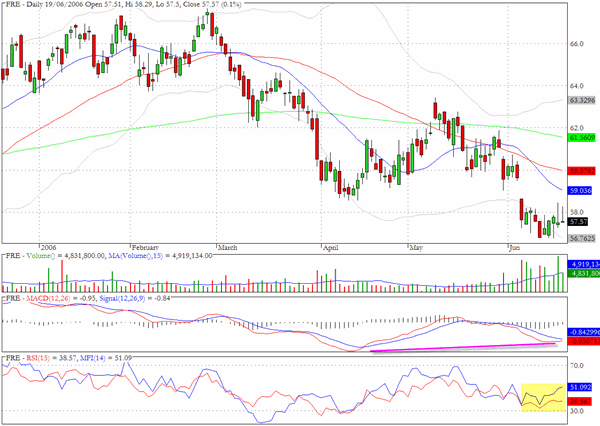
We would be cautious in general at the moment and especially on the long side, but Freddie Mac (FRE) is displaying some positive divergences.
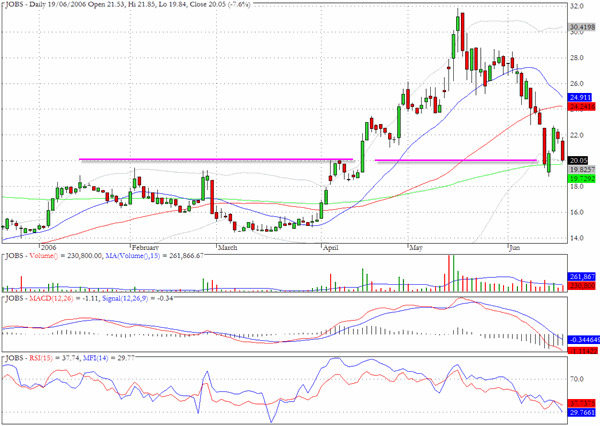
51job sold off yesterday, declining by more than 7% but not on greatly increased volume. It has now reached a critical chart level just above $20 which also coincides with the 200 day EMA.
Clive Corcoran is the publisher of TradeWithForm.com, which provides daily analysis and commentary on the US stock market. He specializes in market neutral investing and and is currently working on a book about the benefits of trading with long/short strategies, which is scheduled for publication later this year.
Disclaimer
The purpose of this article is to offer you the chance to review the trading methodology, risk reduction strategies and portfolio construction techniques described at tradewithform.com. There is no guarantee that the trading strategies advocated will be profitable. Moreover, there is a risk that following these strategies will lead to loss of capital. Past results are no guarante of future results. Trading stocks and CFD's can yield large rewards, but also has large potential risks. Trading with leverage can be especially risky. You should be fully aware of the risks of trading in the capital markets. You are strongly advised not to trade with capital you cannot afford to lose. This article is neither a solicitation nor an offer to buy or sell securities.