What will you do if your trading account goes up 50%? Answering this question is fun, but let's answer a question that's more important. What will you do if your account drops 25%? What about 50%? Most traders have a limit to how of much a drawdown they are willing to accept. Some traders also have a limit to what they can afford to lose before they stop trading. Most traders won't accept the risk of a 100% drawdown. You shouldn't either. If it's over 50% likely that you will experience a 100% drawdown, it won't belong before you are wiped out.
The reasons that these questions are important is that EVERYONE has a drawdown limit. The real question is, "is your portfolio constructed in a such a way that this drawdown limit is unlikely?" Did you know that it is possible to estimate the likelihood of a 50% drawdown or any other amount as well? Many professional traders consider the probability that they will experience a drawdown far enough that will put them out of trading. The risk of this happening is called risk of ruin. Today, we will discuss risk of ruin, how to estimate the probability of it occurring, and how to make the necessary adjustments to your portfolio. Our aim is to help you construct your portfolio in the appropriate way to manage risk.
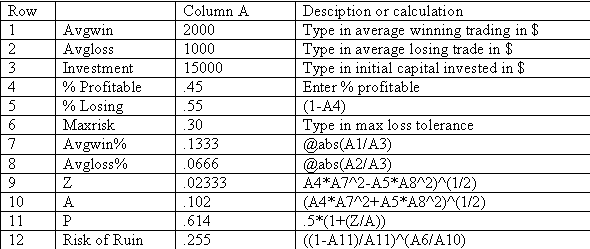
In order to estimate risk of ruin, you will need detailed information about your trading system. If you don't have software (like Tradestation of Trade Navigator) that shows strategy performance information, you can look at your old trades and put them into a spreadsheet. You will need the following information (where it says e.g) the rest of the numbers you'll have to calculate.
- Avgloss- average losing trade (e.g. $2000)
- Avgwin - average winning trade (e.g. $1000) Investment- initial amount invested (e.g. $15,000)
- % Profitable - percentage of total trades winners (e.g., .45)
- % Losing - percentage of total trades losers (e.g., .55)
- Maxrisk- maximum amount a trader can afford to lose before stopping trading (e.g. .30)
- Avgwin% - @ABS(avgwin/investment)
- Avgloss% - @ABS(avgloss/investment)
- Z - the sum of possible events A - the square root of the sum of the squares of possible events
- P - .5*(1+(Z/A))
Using the above example numbers, here is how to input this into Excel:

In this example, the probability of ruin on an ongoing basis, is 25.5%. Would you be willing to trade if you knew the probability of a 30% drawdown was 25.5%? This is the question you need to ask yourself. You should also take note that the easiest way to reduce the chances of a 30% drawdown is to reduce the amount of your portfolio invested into each trade. For example, if you increase your initial investment from 15K to 45K (which shrinks the size of each trade in percentage terms), the probability of ruin drops to a miniscule 1.7%. This also tells us that if we keep our position sizing (in dollars) the same on new trades, things become less risky as the portfolio increases in size.
Going through this exercise can be a very eye-opening experience for a lot of traders, especially options traders. One thing to keep in mind though -most trade software like Trade Station, will give you strategy performance reports that are based on stocks (like average dollars gained per trade) and this data must be adjusted if you are trading options. Option prices are much more volatile than the underlying stocks they are based on, so make the necessary adjustement. For one of our services, the options move 10 times more than the underlying stocks. So when I get my information from TradeStation, I multiply average dollars of winning trades by 10 to estimate risk in options portfolios. Use this formula for you and your friends. If you want details on the math behind this, check out books by Perry Kaufman and Fred Gehm.
Price Headley is the founder and chief analyst of BigTrends.com.