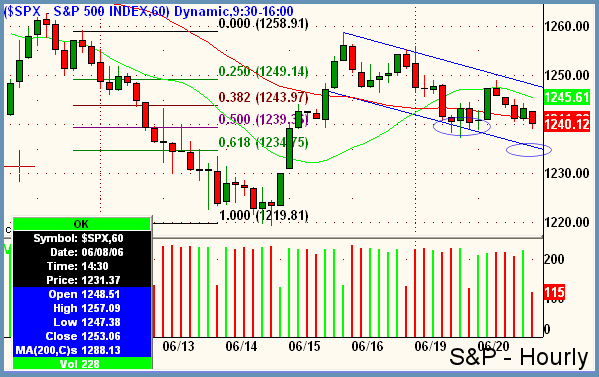
Good Morning, Traders. Relatively flat close on Tuesday with some divergent top-line figures that put the Dow ahead by about 33 points, while the S&P and Nasdaq closed slightly negative and very close to Monday's closing level. Housing Starts and Building Permits, neither of which being huge market movers along the lines of payroll figures, were the only economic data on the slab and caused a mildly bullish start to the day, which began to fall apart just before lunch and stayed bearish for the remainer of the session deflating all of the early gains. Breadth closed mixed on the two exchanges, positive on the Nasdaq and negative on the NYSE, with advance decline lines registering about -350 on both sides. So overall, internals remain bearish as the market slides sideways to down. In the chart below, I look at an hourly of the S&P to analyze the price channel that is forming in the pullback from the June 15 rally that broke a near-term downtrend. I overlayed a Fibonacci retracement from high to low of the June 15 rally as well. Note that so far the pullback has been rather orderly and forming the channel that you see below defined by the diagonal blue lines. The termini of these two blue lines is where traders should be drawing their attention in Wedensday's trade. Wednesday's session should be interesting because on either side of these endpoints we have key technical pivots. There is strong resistance of S&P 1250-1260. We have already discussed at length the resistance that looms ahead at S&P 1250 to 1260. At the lower end of the channel are the Fibonacci retracement areas of 50% and 61.8%. Given that we already saw a slight lift in the markets Tuesday off of the 50% retracement and the fact that in Tuesday's afternoon trade we gave it all back, it would lead us to believe that the channel will continue to expand further to the downside, at least to the 61.8% retracement area, which is currently 1234.75 in the S&P. Any breaks below that level in the S&P will then strongly weaken the odds that the upper band of the channel will get broken and near-term bias will remain downwards. Don't expect any clues from economic data as crude oil inventories from the DOE are the only figures due out Wednesday, with the more important Initial Claims figures expected before Thursday's open.

Peter Reznicek is the Chief Equity Strategist and a principal of the Prana Fund, a domestic hedge fund, and ShadowTrader, a subsidiary of thinkorswim which provides coaching and education to its clients on both intraday and swing trading of equities. For a free trial to the full version of The Big Picture or to learn about ShadowTrader's other services, visit shadowtrader.net or send an email to preznicek@shadowtrader.net.