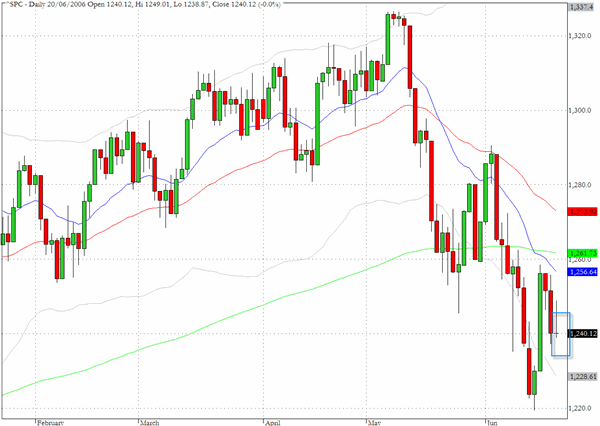
Most of the indices drifted away from their positive start in yesterday's trading and ended the session closer to their lows than to their intraday highs. The S&P 500 chart reveals an inside day with a Doji candlestick with a long upper shadow. This unusual pattern can sometimes be a signal for a turning point in the near term direction as position traders are resetting their expectations.
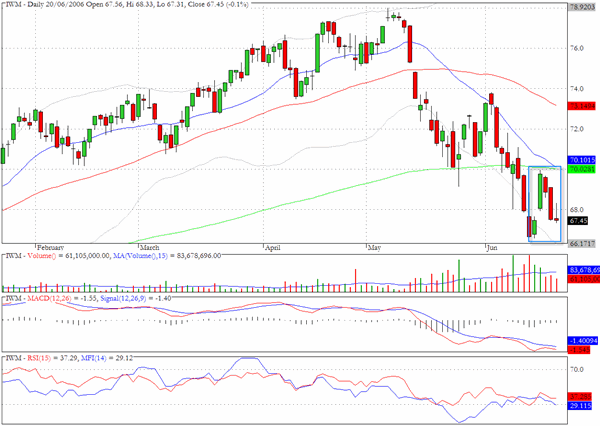
The Russell 2000 cash index slipped back by slightly in yesterday's trading and is still within a price zone where we cannot draw any conclusions about the retest of last week's lows. The chart for the proxy IWM reallt provides little guidance except that we cannot point to any obvious signs of a shift in the money flow and momentum dynamics.
One of the more constructive charts is for the broker/dealer sector (^XBD) which closed yesterday just below the 200 day EMA and also registered an inside day. The inside day pattern is significant at this juncture since a retest of Monday√Ę‚,¨‚"Ęs low was avoided which could suggest that traders believe that Monday√Ę‚,¨‚"Ęs action provided an answer to the larger question of whether last week√Ę‚,¨‚"Ęs lows can hold.

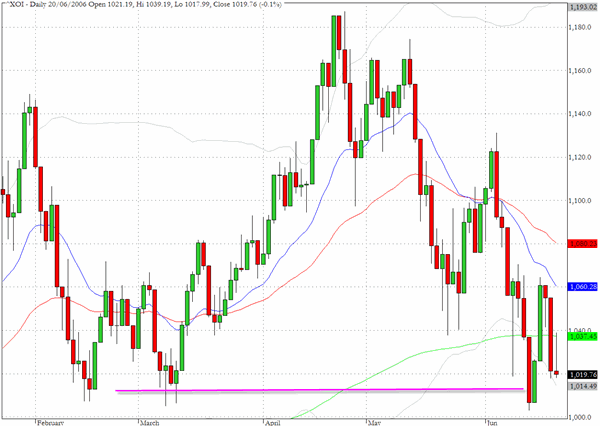
The chart formation for the oil sector index (^XOI) bears a striking resemblance to the one that we noted for the S&P 500. Again we have an inside day with a long upper shadow and with the 200 day EMA just above the close. It may be that the issues that will resolve this pattern are quite different from those for the broader market.
TRADE OPPORTUNITIES/SETUPS FOR WEDNESDAY JUNE 21, 2006
The patterns identified below should be considered as indicative of eventual price direction in forthcoming trading sessions. None of these setups should be seen as specifically opportune for the current trading session.
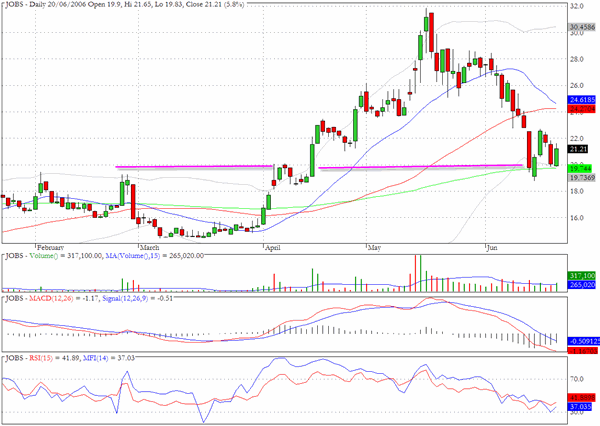
In yesterday's column we cited the fact that 51job (JOBS) had reached a key chart level where some support could be expected and the stock made a nice bounce of more than five percent from the $20 level.
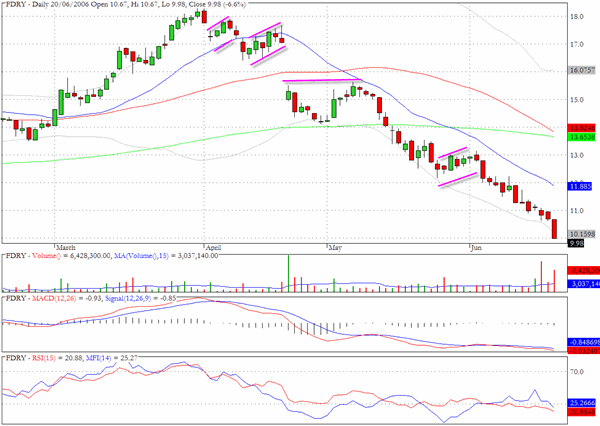
Foundry Networks (FDRY) seems to be carving out a downwards escalator following the two consecutive bear flags in eary April.
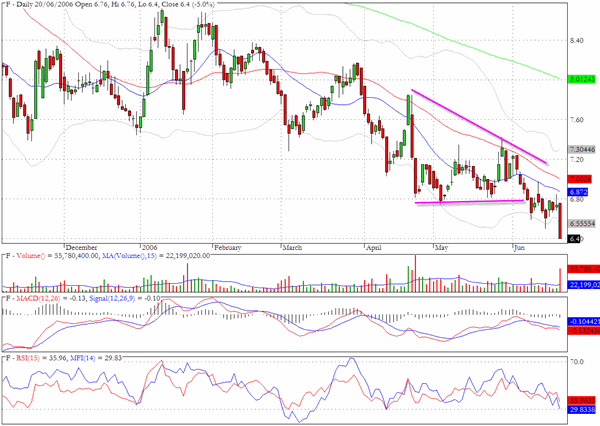
Ford shows a good example of a break down from a very clearly defined descending triangle or wedge formation.
PMC Sierra (PMCS) in the semiconductor sector is also displaying some positive divergences

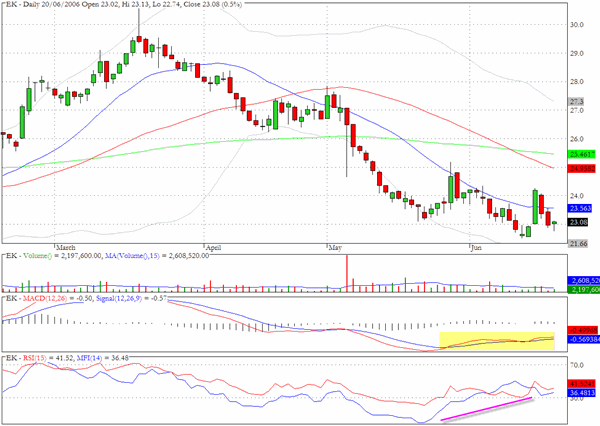
Eastman Kodak (EK) has some positive divergences.
Clive Corcoran is the publisher of TradeWithForm.com, which provides daily analysis and commentary on the US stock market. He specializes in market neutral investing and and is currently working on a book about the benefits of trading with long/short strategies, which is scheduled for publication later this year.
Disclaimer
The purpose of this article is to offer you the chance to review the trading methodology, risk reduction strategies and portfolio construction techniques described at tradewithform.com. There is no guarantee that the trading strategies advocated will be profitable. Moreover, there is a risk that following these strategies will lead to loss of capital. Past results are no guarante of future results. Trading stocks and CFD's can yield large rewards, but also has large potential risks. Trading with leverage can be especially risky. You should be fully aware of the risks of trading in the capital markets. You are strongly advised not to trade with capital you cannot afford to lose. This article is neither a solicitation nor an offer to buy or sell securities.