After yet another round of selling to new lows of the year, the market has come back with a rebound that produced the largest single "up" day last Thursday, which was probably more out of reflex reaction to some basic technicals than anything else. This came as a tremendous surprise to those participating in the options markets as this large rally came just a day ahead of monthly expiration. This however, should not really be such a surprise to us as we have been looking for a reaction to these levels in our previous article.
While the rally was huge indeed, noting that it certainly was the largest of 2006, and in fact, for at least two years prior, it is still dwarfed by the even larger sell-off that has preceded it. Let's take a quick look at both the S&P 500 and Nasdaq on the daily scale:
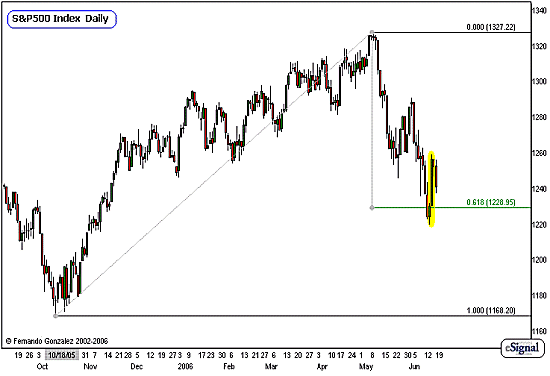
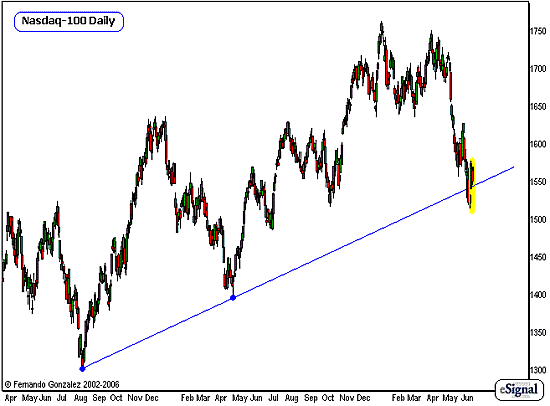
Chart Notations:
The daily charts of the S&P 500 (above) and Nasdaq-100 (underneath) address the short-term time frames (3 months or less)
Note that the S&P 500 has reacted to a 62% Fib retracement on this time scale, which coincides with a primary degree trendline on the Nasdaq - to have been surprised by the strong upward reaction of the markets late last week would have been hard in light of these
This upward reaction however, is still dwarfed by the larger sell-off that preceded it, and in these time frames, the dominant pressure of the markets is still down. We should however allow the market room to react upward, even if it is quite apparent to us that this is merely short-term reflex to very oversold conditions.
Let's take a look at the smaller time horizons to see what we can expect over the next few trading days:
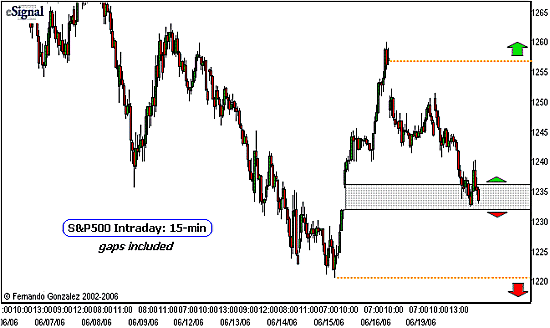
Chart Notations:
The 15-min intraday chart of the S&P 500 addresses the very short-term time horizon ahead (10 trading days or less). Our chart above goes back nine trading days.
Note that the action over the last couple of the trading days has taken the market back down to a gap it had left open just before that huge up-day last Thursday (gray).
This area is a neutral zone where the market is likely to find support before continuing the reflexive upward move last week. In the days ahead, we are looking for the market to continue upward towards to cover the gap left open from Friday morning (yellow dotted line, on top), so long as the market is trading above our gray or "neutral zone."
If the market moves below the Neutral zone, we are looking for downward pressure to continue and take the market to new lows (yellow dotted line, on the bottom).
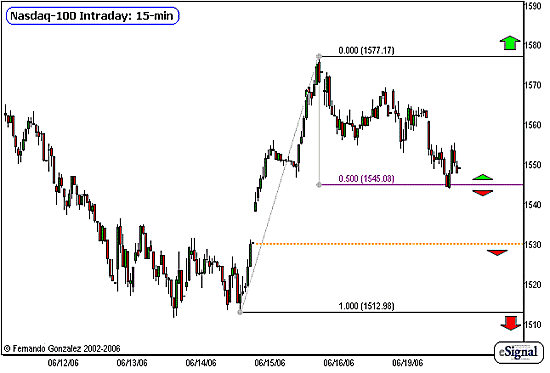
Chart Notations:
Our Intraday 15-min chart of the Nasdaq (NDx) above addresses the very short-term time horizon ahead (10 trading days or less). Our chart shows us six trading days of price action.
Note that the Nasdaq is carrying a greater degree of relative strength in comparison to the S&P 500 as the last two days has not even taken this market down to the open gap left from last Thursday. This is a good sign for the bullish scenario over the next few trading days.
Let's also note that so far, this retracement is right at about the 50% retracement point of the rally last week. Let's look for the bulls to keep the pressure on towards a move to a new swing high, but only so long as we are trading above the 50% retracement point.
On the bear-side, movement below the 50% retracement puts the open gap underneath the market into play (yellow dotted line).
Fernando Gonzalez is in his 10th year as an active trader, technical analyst and content contributor to the active trading community and a long list of popular financial media. Online Trading Academy trading knowledge...your most valuable form of capital.


 Free Festival of Traders Videos