NASDAQ Commentary
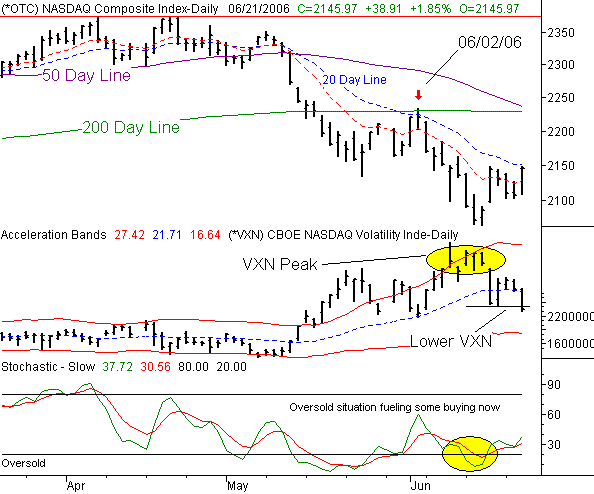
Wednesday's rally has managed to put the NASDAQ Composite back into profitable territory. For the week, the index is up by 0.75%. The current reading of 2145.97 is 16.02 points higher than Friday's close, with some more upside pressures brewing up.
In Saturday's Weekly Market Outlook, we examined how the market was potentially going to keep heading higher in the short-term. Even though the previous week was bullish, most indices had not yet run into any serious resistance levels - that was likely to happen this week. At the time, our opinion was that stocks would indeed drift a little higher, but ultimately resume the downtrend once the oversold condition was relieved. And from an unbiased point of view, that's basically what happened over the last three days.
While our intention was to turn bearish once the buying effort stalled, a closer inspection may be steering us in a different direction now.....a bullish direction. It's still too soon to say, but the bounce over the last three days has disrupted a lot of the underlying bearish indications that generally guide our opinion.
Specifically, the CBOE NASDAQ Volatility Index (VXN) has clearly made a lower low, in the wake of what has become defined as a peak. With the VXN trending lower while the NASDAQ trends higher, the odds are much better that the bulls will get some traction now. That's just something that we didn't' know we were going to see in our last report.
But like we said, we're not quite there yet. The 20 day moving average line at 2151 has stopped the NASDAQ's advance today, which brings back memories of the turn-around from June 2nd. Things looked as bullish then as they do now, but that rally stopped and turned on a dime. We don't want to risk that again, so we're going to wait for a couple of closes above 2151 before taking a firm bullish stance. That could be as early as this coming Friday though.
NASDAQ Chart

S&P 500 Commentary
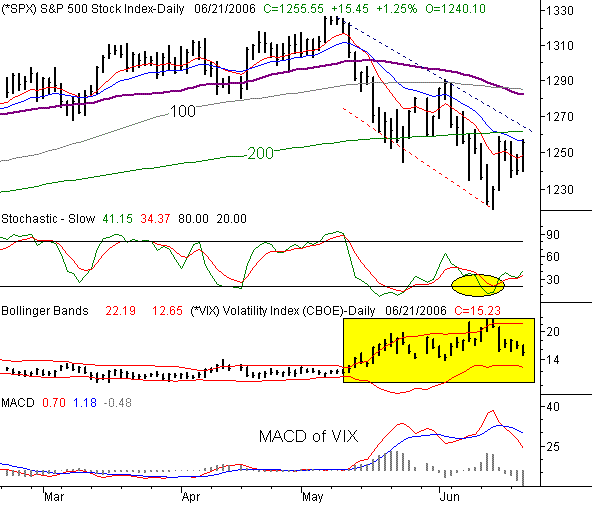
The 0.32% gain for the S&P 500 this week trails that of the NASDAQ, but it's still a positive. As of right now, the SPX is up by 4.0 points on a weekly basis, last trading at 1255.55. The move has caught our eye, but there are still a couple of things that need to happen before we can switch gears and turn bullish.
Despite being up for the week, the SPX is also having some trouble with its 20 day average line at 1256. But for the S&P 500, there's a lot more resistance in the vicinity. The 200 day line is at 1256, while a short-term resistance line (dashed) looms at 1264. In seeing all these potential pitfalls for the bulls, we're going to use the most conservative one as the inflection point - the straight-line resistance at 1264. It's sinking fast though, so by the time it becomes an issue, the resistance could be much lower than that. Wherever it is at the time, we need to see a couple of closes above that mark to really think much of it. Otherwise, this week's strength is just common volatility.
As for what the bulls have going in their favor, we have to acknowledge that the CBOE S&P 500 Volatility Index (VIX) has already signaled bullishly. We've seen it hit lower lows now, and we have a decisive MACD crossunder for the VIX. Both are bullish for stocks, as long as that resistance line can get knocked down.
Although it's a little presumptuous, our target for any breakout move is a retracement up to this years highs. For the S&P 500, that's 1326. The 1285 area could be a trouble spot too though - that's where the 50 and 100 day lines are hovering, having already rolled over and completed a bearish crossunder. On the flipside, support is at 1220.
S&P 500 Chart

Dow Jones Industrial Average Commentary
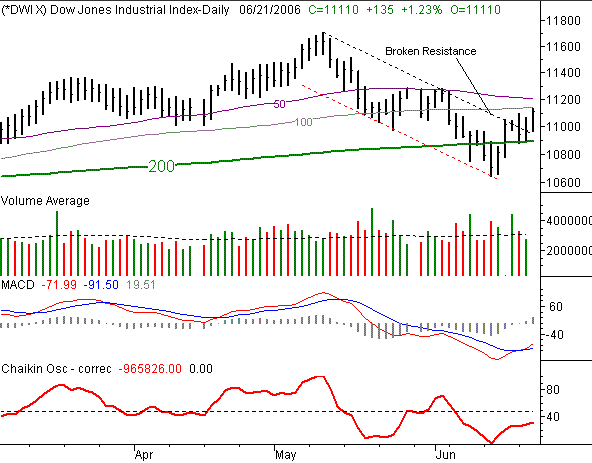
The Dow continues to lead the pack. It's up by 0.86% for the week, or 95 points above Friday's close. That puts the blue-chip index back above the critical 200 day moving average line, but the bulls are not yet out of the woods.
We've been saying repeatedly, but accurately - the Dow is the place to be for long-term bulls. The recent broad weakness (with rare exception) hasn't hurt the Dow as badly as other stocks, but the Dow has easily outperformed the other indices when the buyers were active.
That's why the industrial average was - and is - in the best technical position to become fully bullish. The Dow is back above its 200 day line, and it's already breached the resistance lines (dashed) that are still a problem for the other two indices. The 100 day line at 11,140 has been verified as resistance today. However, given that we're only a few more points under the 50 day average, that will be our make-or-break line. If the Dow can make a couple of closes above the 50 day line at 11,209, we'll look for the index to keep moving even higher....maybe even beyond this year's high of 11,709. Support is at 10,894, or the 200 day average.
Dow Jones Industrial Average Chart

Price Headley is the founder and chief analyst of BigTrends.com.