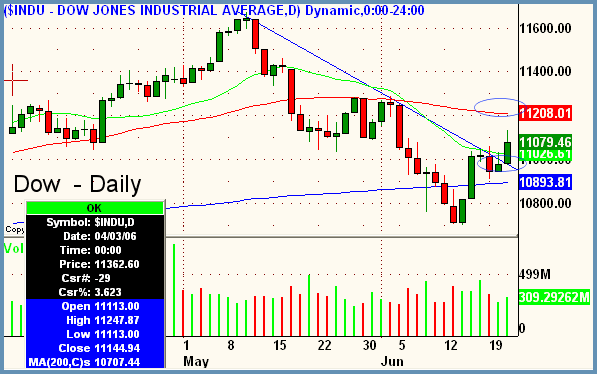
Good Morning, Traders. Interesting pivot we are at here in the broad markets. Recent commentaries have discussed key trendline, Fibonacci, and prior low resistance in the 1255-1260 area of the S&P. The S&P is still stuck under that area after attempting as high as 1258 yesterday, however the Dow has broken through. Of the three major averages that we watch (Dow, Nasdaq, S&P), the Dow is probably least important to us as its the narrowest measure. Still it's worth pointing out the divergence that is occurring between the three. In the picture below, you can clearly see how the Dow has now broken through the first lower blue circled area which is the same resistance that the S&P is still battling. While this was happening during Wednesday's trade, the aforementioned S&P stopped just below the resistance of the downtrend and the Nasdaq closed right at its downtrend resistance in the 2145 area. So, going into today's trade we have an S&P and Nasdaq that are a bit stuck with a Dow that is poised to possibly move to the second circled blue area at the 11210 area, which also corresponds with the 50-period moving average (red) that is chopping sideways across the chart. There is a cluster of prices (congestion) from late May in this area which would indicate a possible target and short term pause for the Dow in this area. The question then is which will prevail in today's session, the relative strength of the Dow or the slight relative weakness in the S&P. Impossible to say at this juncture, only that on an intraday basis if either happens we will know. During today's session, pull up the big weight Dow names early in the session (UTX, MMM, IBM, CAT, AIG....) and see how they act within the first 15-30 minutes of trading. Will they make strong big bodied candles to the upside, or will they chop around at the open? How will volume in these names look? Stronger than average or weak? These could be some clues as to which direction will prevail in today's session. Remember rallies in the context of downtrends are often fast and furious as shorts scramble to cover. If the S&P and Nasdaq can get above their respective daily downtrendlines early in today's session, then quick covering could ensue. Overall, it's a tough pickle here and even tougher to call in advance with the Dow breaking out slightly and the bigger benchmark index (S&P) sitting under major technical resistance. Adopt a wait and see attitude. Trade it once the train has left the station. Buy your tickets on the train, not in advance on the platform.

GLD - StreetTracks Gold
Industry - Gold
Side - Long
Trigger - 58.87
Stop - 55.90
Target - 65.00+
Timeframe - multiweek to multimonth
Notes
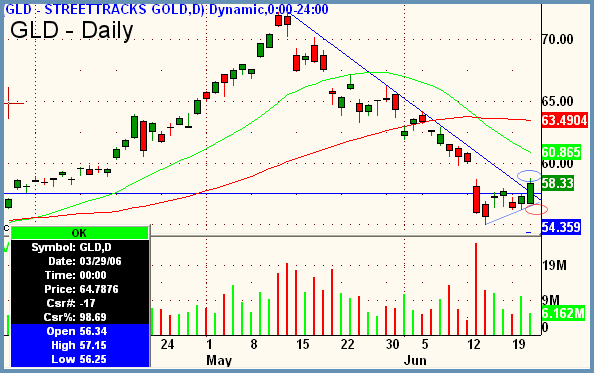
- This is an ETF that tracks the price of gold bullion. One ounce of gold trades at approximately 10x the value of this stock.
- Downtrend of pullback broken with a strong upday closing at highs.
- Trades in gaps, be careful. Spot gold trades around the world around the clock, this issue trades U.S. east coast market time. Almost impossible to set one trigger on this issue. Prudent invetors will enter piecemeal in the 56-59 area for a long-term hold.
- Target listed is for a 50% retracement of downswing, but overall target is much higher.

Peter Reznicek is the Chief Equity Strategist and a principal of the Prana Fund, a domestic hedge fund, and ShadowTrader, a subsidiary of thinkorswim which provides coaching and education to its clients on both intraday and swing trading of equities. For a free trial to the full version of The Big Picture or to learn about ShadowTrader's other services, visit shadowtrader.net or send an email to preznicek@shadowtrader.net.