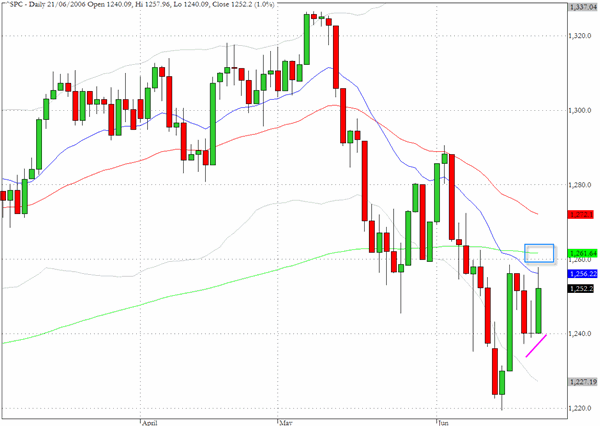
The hypothesis that Monday's lows on the indices were going to hold following the plethora of inside days that were evident on the charts following Tuesday's session, seems to have been validated by yesterday's session. So have we seen off the possibility of another challenge to the low below 1220 on June 13th? In the near term we suspect that the answer is yes but this index still has to face a formidable challenge as it needs to break above the trend line through highs from early May and the 200 day EMA at 1262.
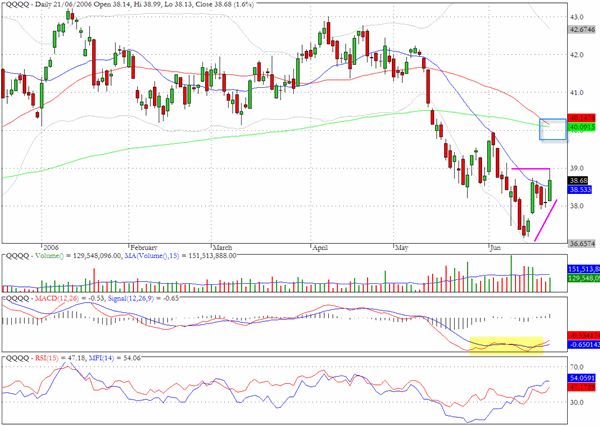
The Nasdaq 100 (^NDX) had a very positive session yesterday as it moved up 1.6% and could be headed back to the 1630 area on the cash index or 40 on the QQQQ proxy. Reviewing the volume and money flow charts for QQQQ suggests that there has been some bargain hunting and this could continue through what remains of the quarter.
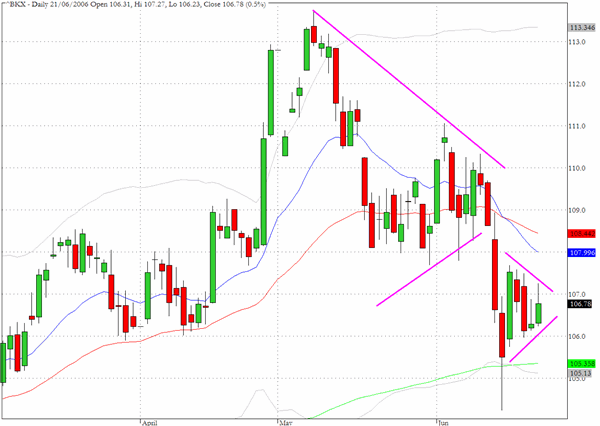
The banking sector (^BKX) has a chart that could be of concerns to the bullish argument. The current pennant lies just beyond a rather larger similar formation which has been corrective in nature. Bond yields are increasing and fund managers may be reaching the conclusion that the underlying financial economy may be less constructive for the banks than it has been for a long time.
Again this has to be balanced by the fact that portfolio window dressing for the next few sessions could provide near term support. From the perspective of the overall market it would seem to be crucially important that the 200 day EMA support is respected.
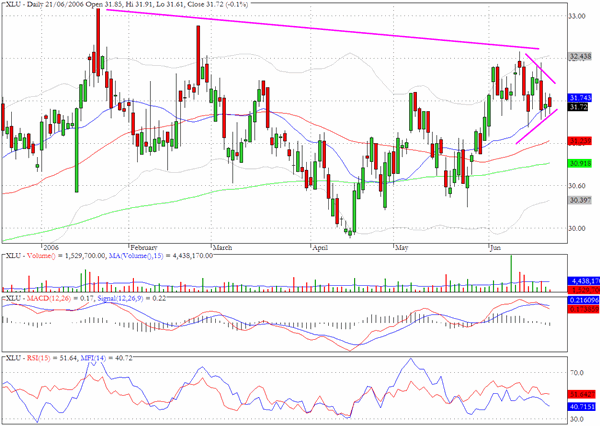
Continuing the theme that we raised with regard to the banking sector there may be some similar concerns for the utilities. The XLU chart could be telling a similar story to the one for ^BKX and we could be ready for some further weakness as the price has moved back to a declining trendline that dates back to earlier this year.
TRADE OPPORTUNITIES/SETUPS FOR THURSDAY JUNE 22, 2006
The patterns identified below should be considered as indicative of eventual price direction in forthcoming trading sessions. None of these setups should be seen as specifically opportune for the current trading session.
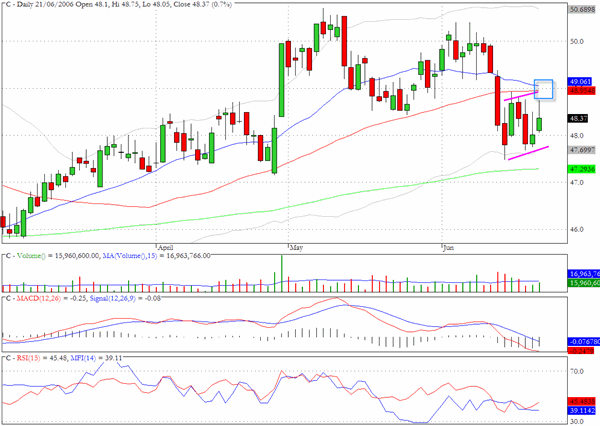
Within the banking sector Citibank (C) has a pullback formation from the recent bout of selling that could potentially lead to resumed selling at the point we have highlighted on the chart which is where the 20 and 50 day EMA's have converged.
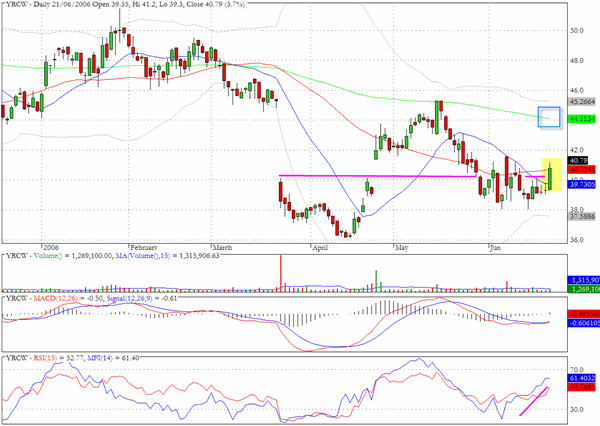
YRCW (which used to be called Yellow Roadway) broke above an important chart level in yesterday's trading and the momentum and money flow could see a return to the $44 level.
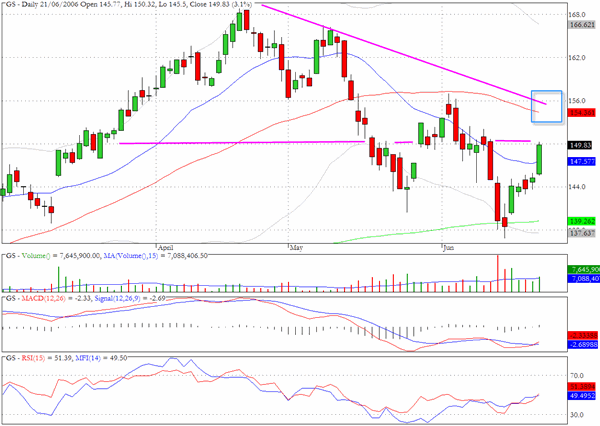
We would expect to see Goldman Sachs continue its rally to the $156 level.
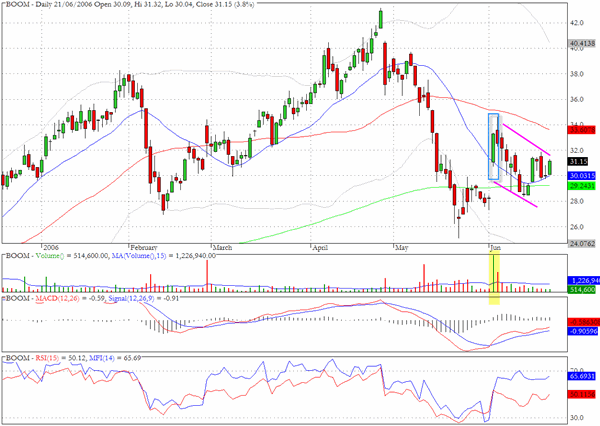
Dynamic Materials (BOOM) has a bullish flag formation and as the chart highlights there was a powerful upsurge at the beginning of June which has been accompanied by subdued volume on the pullback. This is all supportive evidence for the belief that we shall see a resumption of the buying interest in coming sessions.
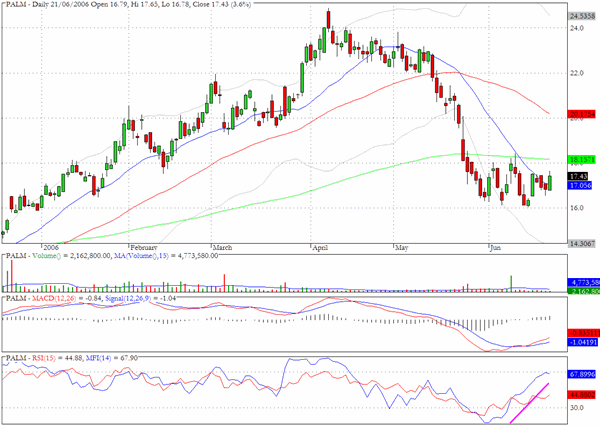
The MFI chart for PALM has a very strong upward bias that has been in effect for most of June but the $18 level which has been an area for previous support may now provide near term resistance. But a move up to the 200 day EMA just above $18 could well be imminent.
Clive Corcoran is the publisher of TradeWithForm.com, which provides daily analysis and commentary on the US stock market. He specializes in market neutral investing and and is currently working on a book about the benefits of trading with long/short strategies, which is scheduled for publication later this year.
Disclaimer
The purpose of this article is to offer you the chance to review the trading methodology, risk reduction strategies and portfolio construction techniques described at tradewithform.com. There is no guarantee that the trading strategies advocated will be profitable. Moreover, there is a risk that following these strategies will lead to loss of capital. Past results are no guarante of future results. Trading stocks and CFD's can yield large rewards, but also has large potential risks. Trading with leverage can be especially risky. You should be fully aware of the risks of trading in the capital markets. You are strongly advised not to trade with capital you cannot afford to lose. This article is neither a solicitation nor an offer to buy or sell securities.