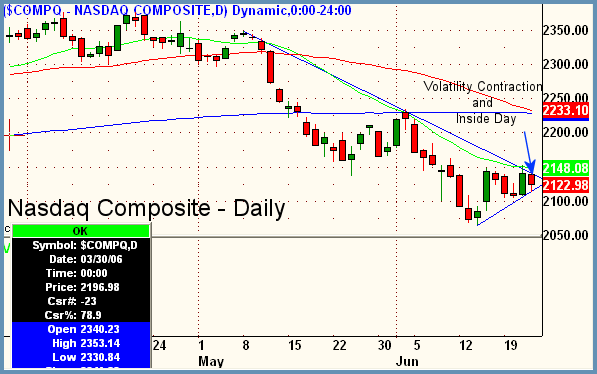
Good Morning, Traders. In yesterday's commentary we said we were at an "interesting" pivot here in the markets. We discussed the Dow breaking out ahead of the S&P and Nasdaq to snap a downtrend and the key technical resistance that is holding the S&P back at this juncture. Lo and behold, the markets responded knowingly in Thursday's session by having what trader call an "inside day." An inside day is one where the entire range of the market for the current day is inside of the entire range of the prior day. Although only the Nasdaq Composite is shown in the chart below, note that the $SPX and $DJX also had inside days as well. The main thing to note is that an inside day is a form of volatility contraction which makes moves more pronounced once the entire range is broken out of. This is what will probably happen in today's session. I am focusing specifically on the Nasdaq today to show how the inside bar is lining up right with trendline resistance and support to form a symmetrical triangle. Just the formation of the wedge (blue) would be enough to tell us that the market is about to break in either direction. Yesterday's inside day only winds it up like a top a bit more. As always, the $64,000 question is which way will it break. And, as always, the I will tell you wait and see. As we discussed yesterday, there are just too many technical factors pulling the market in either direction right now to know. Wednesday's strength in the Dow did not translate into a follow through for the S&P and Nasdaq that are still caught underneath their respective downtrendlines. Yet the Dow gave back a portion of Wednesday's gain but not all, so its breakout move is not invalidated, especially as price still sits above the trendline. So again, buy your tickets on the train, not on the platform. Overall bias still remains down with near-term bias sideways. Expect an increase in volatility today in tech stocks if the Nasdaq moves to either side of the wedge above.

Peter Reznicek is the Chief Equity Strategist and a principal of the Prana Fund, a domestic hedge fund, and ShadowTrader, a subsidiary of thinkorswim which provides coaching and education to its clients on both intraday and swing trading of equities. For a free trial to the full version of The Big Picture or to learn about ShadowTrader's other services, visit shadowtrader.net or send an email to preznicek@shadowtrader.net.