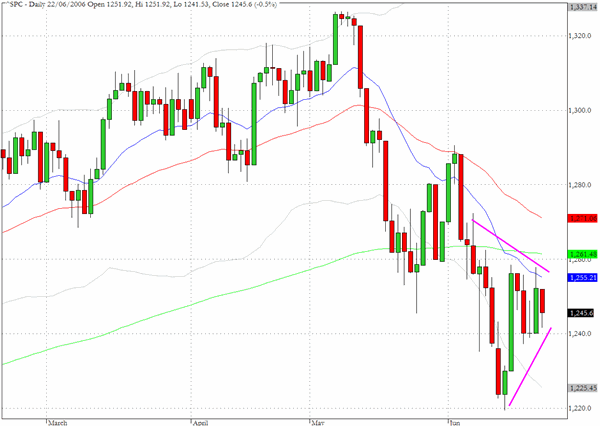
The S&P 500 cash index (^SPC) recorded its second inside day this week (Tuesday's action was also in this category). This suggests to us that the market could be at a significant inflection point, a view which is reinforced by the symmetrical nature of the pennant formation.
We may well be preparing for another big move but we also remember that earlier this year during much of February and March the indices continued within a broad range of such pennants without any dramatic resolutions.
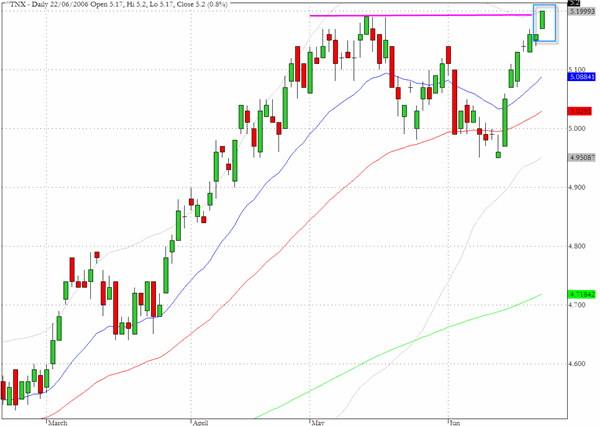
The yield on the 10-year Treasury note continued its push higher to reach 5.2%, its highest value since May 2002. Perhaps this factor alone was the major contributor to yesterday's afternoon weakness in equities and should we continue to see higher bond yields this will make it that much harder for the broad indices to make sustained upside progress.
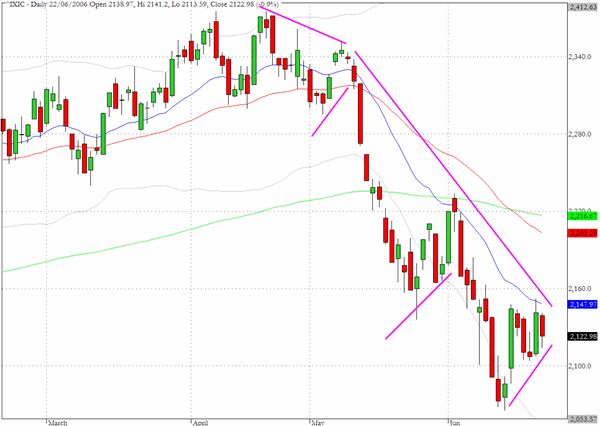
In common with the patterns found on many charts for the indices and sectors, the Nasdaq Composite Index (^IXIC) also has a clear pennant formation. Not for the first time (or the last) there are some contrary signals being given at the moment.
On the one hand a plausible case could be made that we have seen two fairly clearly defined moves down since late April (plus the relief rally in late May) and we could now be preparing for a sustained move back upwards. On the other hand a pretty good case could be made that the formations are consistent with further continuation of the larger move downwards.
TRADE OPPORTUNITIES/SETUPS FOR FRIDAY JUNE 23, 2006
The patterns identified below should be considered as indicative of eventual price direction in forthcoming trading sessions. None of these setups should be seen as specifically opportune for the current trading session.
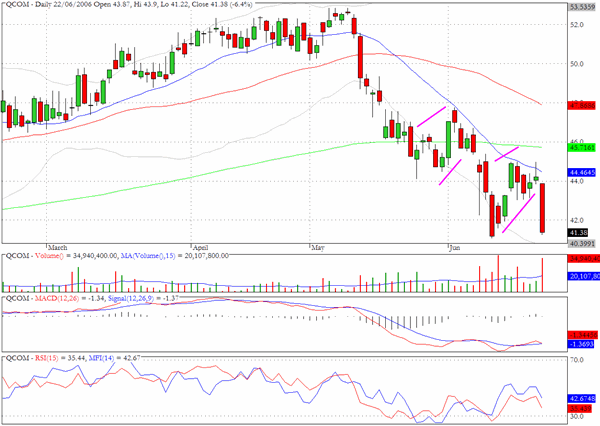
QCOM is one of the bellweather tech names and yesterday took a big tumble as it dropped back by 6.4% on heavy volume. In reviewing this individual chart we would tend to the view that this pattern is consistent with the more bearish interpretation that could be put on the broader Nasdaq pattern that we discussed. Whether there are special cirumstances affecting QCOM or whether this is a leading indicator will become clearer as we move forwards.
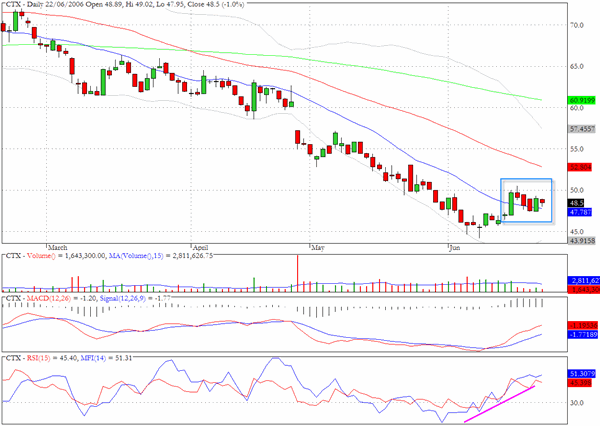
Centex (CTX) is showing some positive divergences and may be ready to mount a relief rally back to the 50 day EMA.
Clive Corcoran is the publisher of TradeWithForm.com, which provides daily analysis and commentary on the US stock market. He specializes in market neutral investing and and is currently working on a book about the benefits of trading with long/short strategies, which is scheduled for publication later this year.
Disclaimer
The purpose of this article is to offer you the chance to review the trading methodology, risk reduction strategies and portfolio construction techniques described at tradewithform.com. There is no guarantee that the trading strategies advocated will be profitable. Moreover, there is a risk that following these strategies will lead to loss of capital. Past results are no guarante of future results. Trading stocks and CFD's can yield large rewards, but also has large potential risks. Trading with leverage can be especially risky. You should be fully aware of the risks of trading in the capital markets. You are strongly advised not to trade with capital you cannot afford to lose. This article is neither a solicitation nor an offer to buy or sell securities.