NASDAQ Commentary
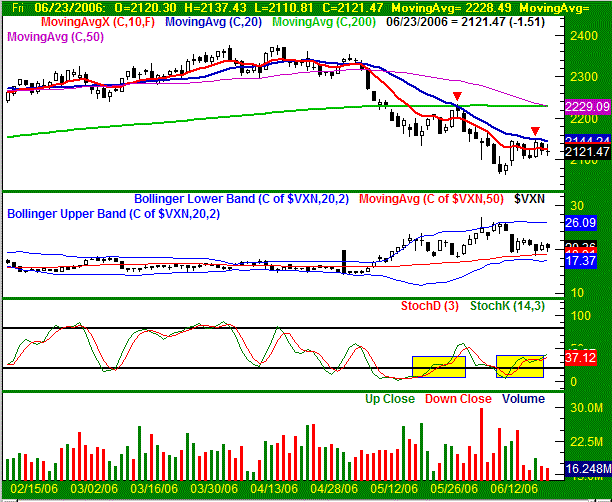
The NASDAQ's close at 2121.47 on Friday was the result of an 8.48 point loss for the week. It was only a 0.40% dip, but still a far cry from the bullishness that was hinted at a couple of times over the last few sessions. Although the underpinnings are still bullish, the fact of the matter is the NASDAQ is being held down pretty well by its short-term moving averages.
The trouble spot is the 20 day moving average line (blue) - the precise turn-back point on Wednesday as well as Friday. It wouldn't be as big of a deal if it were not also the turn-back point on June 2nd. Being unable to get back above the 20 day line then resulted in about a 140 point dip. That's why we don't want to jump the gun now...the current price chart looks too much like the chart from early June.
On the other hand, there is one key difference between then and now. Then, the 200 day line (green) may have been the key resistance level. It was placed right where the 20 day line was then as well. So, maybe that was the culprit - we just don't know yet. What we do know is that the 20 day line - at 2142 - is the problem now. Until the NASDAQ can make a close above it, we can't get officially bullish.
That said, we're going to be a little inconsistent here and say that the upside gain potential is far greater than any likely downside move. Although not shown on our chart, we saw several internal indications (based on breadth and depth) of a capitulation on the 12th and 13th...the days that resulted in the lowest close of the year (2072.47). We got hints that it was indeed a bottom, in the form of a sharp rally over the next two days. However, we've gone nowhere since then. In other words, the NASDAQ had defied the odds so far, but the bullish potential is still there. If we do manage to break above the 20 day average - and that's a big 'if' - the upside move could be major, and possibly carry the composite back up to this year's highs (about 300 points). The potential downside move is only about half that size (or 150 points). A close under last week's low of 2103.27 would be the signal for such a downside move.
NASDAQ Chart

S&P 500 Commentary
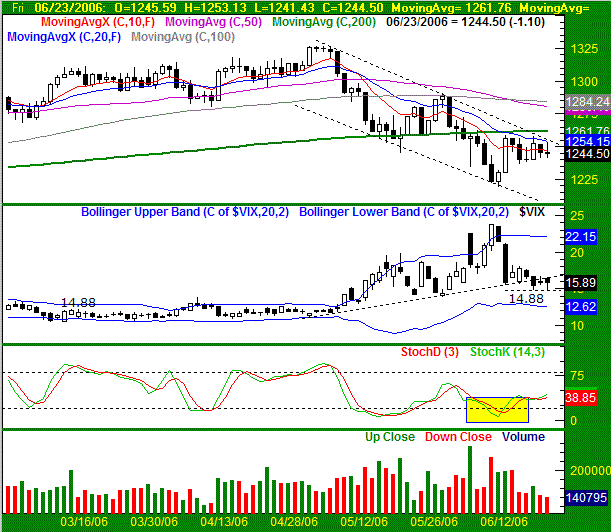
A loss of 7.05 points from last Friday's close left the S&P 500 at 1244.50. The 0.56% dip was slightly bigger than the NASDAQ's, but like the NASDAQ, there was clear resistance at some short-term averages. So, as bullish as the foundation is right now, we can't sink our teeth into the idea of going higher...at least not yet.
Last week we mentioned that the S&P 500 had developed a bearish trading range (see dashed lines). At the time, the index was headed higher, but had yet to reach the upper side of that zone. As such, it was possible that stocks could still head higher over the course of the next few days and still not actually break the bigger downtrend. Well, that's basically what happened. The SPX rallied up to 1256.77 on Wednesday, came close to brushing the upper edge of that zone, and then pulled back on Thursday and Friday. Needless to say, the S&P 500 is still technically in a bearish trend. In this case, only a break above that line would get us to think like bulls again. The bullish confirmation would only come in the form of a close above the 200 day moving average line (green), currently at 1261.75.
The problem is, as of right now, it looks like the SPX is rolling over. By that, we just mean that the rate of gain has become non-existent, and we've started to see a lot of closes on the lower ends of the daily bars. To see it occur right after resistance was hit only makes things that much more bearish. So the bearish concern from here is that we stay within this channel, and fall all the way back to the lower edge, currently at 1204 (and sinking).
On the flipside, there are two upside catalysts. The first one is a stochastic buy signal (highlighted). However, we got a stochastic buy signal about three weeks ago, and that one didn't really pan out. The second bullish sign is in the CBOE Volatility Index (VIX). It had developed a support line of its own, but that line was broken at the end of last week. So with the VIX likely headed lower after peaking at 23.81 on the 13th, we have to give a little credit to the bulls. The final test for the VIX will be a close under last week's low of 14.88. That's where a support line seems to be in place as of Friday, and only a close under that mark would confirm that the VIX is indeed headed lower.
S&P 500 Chart

Dow Jones Industrial Average Commentary
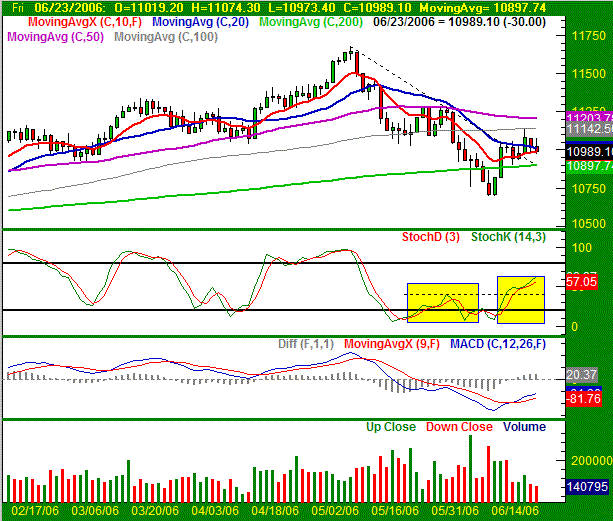
Even in weakness, the Dow is the bright spot, only losing 0.24% this week. The close at 10,989 on Friday was only 26 points below the prior week's close. However, the Dow is also plagued with problems similar to those of the SPX and the NASDAQ - specifically, resistance at some key moving averages. On the other hand, the Dow at least managed to break above significant straight-line resistance (dashed).
For a while last week, it looked like the Dow might end up closing above the 10 and 20 day moving average lines (red and blue, respectively), resulting in a short-term buy signal. But, Friday's weakness pulled the index back under the 10 day line. That pullback was prompted by Wednesday's brief encounter with the 100 day line, then at 11,080. We've now seen this line act as resistance as well as support, so we're going to keep watching it closely. In the meantime, Friday's wasn't the most bullish close we've seen.
On the other hand, the Dow broke above a key resistance line as well as moved back above the 200 day average (green). And, this most recent stochastic buy signal has progressed a lot more than the last one did, so maybe this is the one that will get some traction.
Support is at 10,898, while resistance is at 11,142 and 11,203.
Dow Jones Industrial Average Chart

Price Headley is the founder and chief analyst of BigTrends.com.