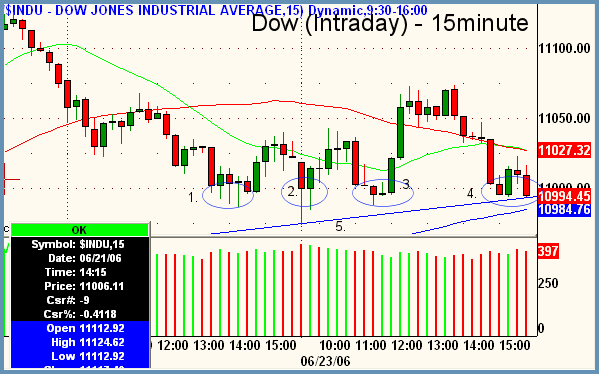
Good Morning, Traders. Markets closed flat on Friday to give us a second inside day in a row in the major averages. Although all three dipped below Thursday's lows in Friday's trade, they did so by so little that 99% of price action remained within the prior day's range. Now that we have had two inside days in a row, we are seeing a type of volatility contraction that I call the "Russian Doll Setup." It's like those little wooden Russian dolls where one fits inside the other and the next fits inside the next until you get one very tiny doll at the end. This is what we call it when we get more than one inside day in a row. This technical phenomena is nothing more than an indication of volatility drying up in the market, which of course means that an expansion is soon to ensue. In Friday's column we noted Thursday's inside day and reported that we were expecting volatility expansion. The fact that it did not come on Friday only winds the market up that much tighter in anticipation of the next move. If we look at an intraday chart of the Dow below, we can see that the price action of the last two days in the market would indicate that Monday's move should be down. Draw your attention to the blue circled numbered areas near the bottom of the Dow chart. What is of note about these circled areas is that they represent tests of 11,000 in the Dow over the last two trading days. Notice how this area has now been tested four times. Generally it doesn't take more than 3 tests of a support or resistance area to break it. In the markets there are "double bottoms", and sometimes even "triple bottoms", but "quadruple bottoms" are extremely rare. The odds just don't support the 11k holding anymore going into next weeks trade. In addition to the circled lows, there is also a blue trendline coming up from the bottom of the chart labeled "5." Although it can't be seen in the attached picture, that is an hourly trendline that has been supporting lows on the Dow since June 15. If you pull up hourlies of the Dow (not shown), you will see this trendline support has also been tested from above many times now and is due to crack soon. If on Monday the Dow closes another hourly bar below 11,000, next stop should be 10,900.

Peter Reznicek is the Chief Equity Strategist and a principal of the Prana Fund, a domestic hedge fund, and ShadowTrader, a subsidiary of thinkorswim which provides coaching and education to its clients on both intraday and swing trading of equities. For a free trial to the full version of The Big Picture or to learn about ShadowTrader's other services, visit shadowtrader.net or send an email to preznicek@shadowtrader.net.