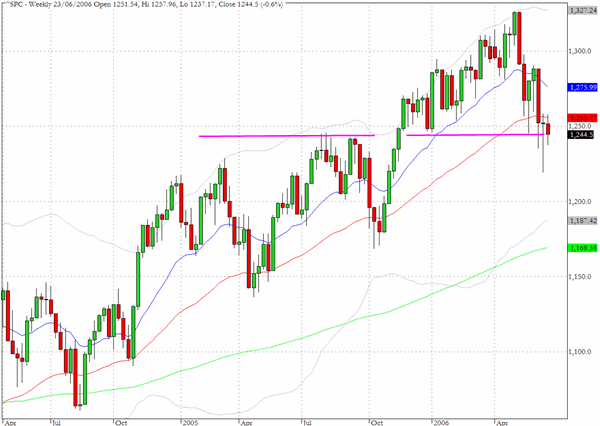
The daily charts are full of triangular or pennant formations so we decided to focus on the weekly charts for a longer term perspective on where the indices are sitting currently. The weekly chart for the S&P 500 shows that we are at a fairly key level where some support for the index is to be expected. Provided that we can remain above the lows from June 13 and 14 around 1220 we would expect to see a move back towards the 1260 level, the 200-day EMA level, prior to the FOMC report.
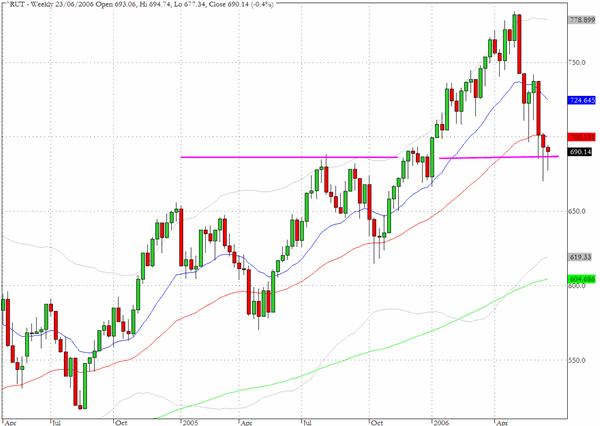
The weekly chart for the Russell 2000 also shows that support is to be expected near current levels. The crucial test of the 680 seems to have passed successfully and we also would not be surprised to see the index in the vicinity of 708 (the 200-day EMA) ahead of the FOMC deliberations.
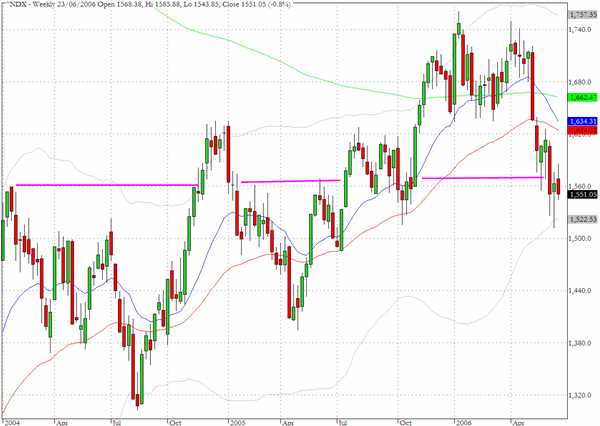
The weekly chart for the Nasdaq 100 (^NDX) is more problematic than the previous two that we have examined. We broke down from the 1620 level in mid-May which would be equivalent to the key chart support levels found on the other two charts and we sit more or less in the middle of two bands of support/resistance one at the 1620 level as we noted and the other that is in the neighborhood of 1500. This index has a lot more ground to make up to reach back towards its 200 day EMA but we do see some positive money flow suggestions on the QQQQ chart. If the markets do react favorably to the FOMC announcement this could be the index that makes the sharpest move.
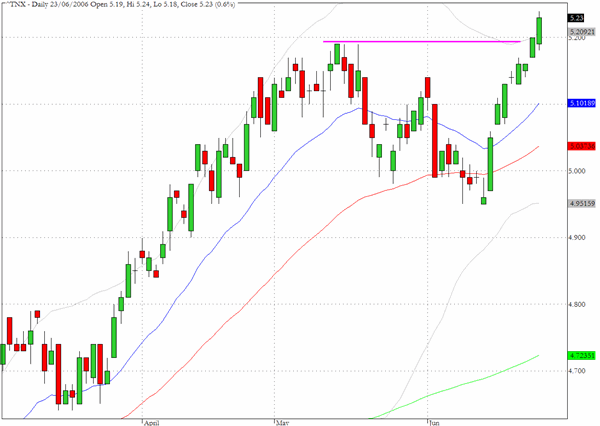
For the next chart we revert from the weekly interval to the daily as the chart below provides a good view of the breakout in yields on the ten year note. Across the yield curve the thirty year maturity has yet to break above its recent range although the five year note finished on Friday at 5.21% which is a level not seen since December 2000.
More than anything it will be useful to keep an eye on this yield in the days ahead as the financial markets react to the rate decision.
TRADE OPPORTUNITIES/SETUPS FOR MONDAY JUNE 26, 2006
The patterns identified below should be considered as indicative of eventual price direction in forthcoming trading sessions. None of these setups should be seen as specifically opportune for the current trading session.
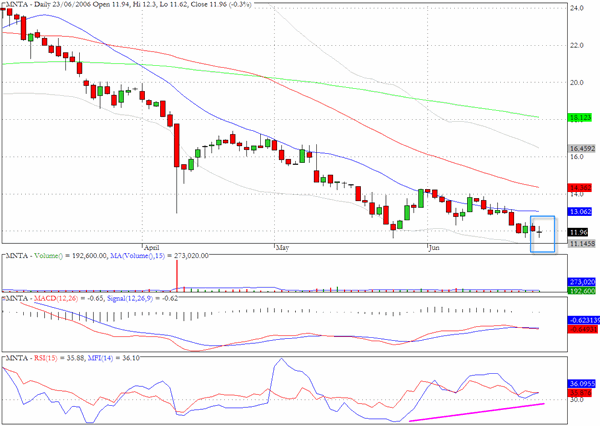
MNTA recorded a tiny Doji formation on Friday and with rising money flow and positive MACD divergences it could be preparing to rally.
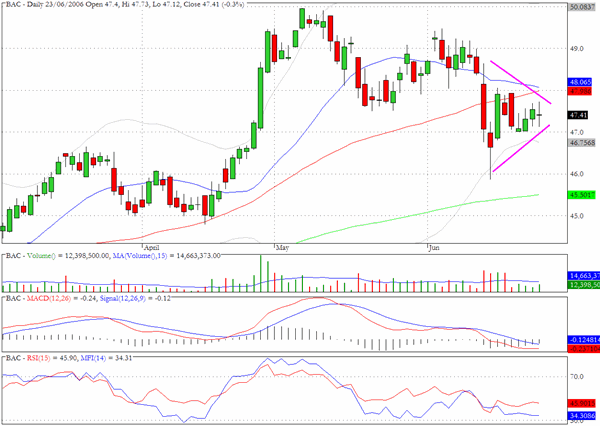
Bank of America (BAC) shows the pattern which is to be found on many stock charts at the moment and especially ones in the financial sector. By the end of this week we should know how this pattern is going to resolve itself.
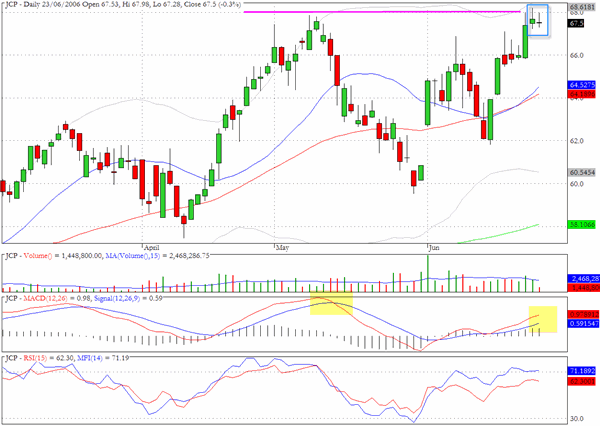
We would expect at least a temporary retreat from the "double top" formation on the JCP chart.
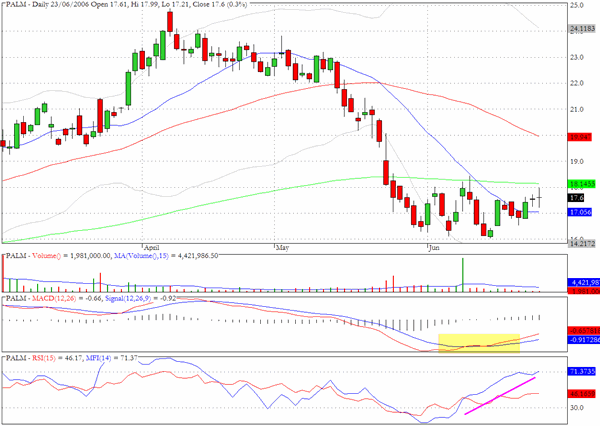
We showed the chart for PALM last week and still see the potential for an upside breakout.
Clive Corcoran is the publisher of TradeWithForm.com, which provides daily analysis and commentary on the US stock market. He specializes in market neutral investing and and is currently working on a book about the benefits of trading with long/short strategies, which is scheduled for publication later this year.
Disclaimer
The purpose of this article is to offer you the chance to review the trading methodology, risk reduction strategies and portfolio construction techniques described at tradewithform.com. There is no guarantee that the trading strategies advocated will be profitable. Moreover, there is a risk that following these strategies will lead to loss of capital. Past results are no guarante of future results. Trading stocks and CFD's can yield large rewards, but also has large potential risks. Trading with leverage can be especially risky. You should be fully aware of the risks of trading in the capital markets. You are strongly advised not to trade with capital you cannot afford to lose. This article is neither a solicitation nor an offer to buy or sell securities.