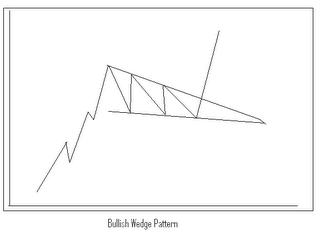
The continuation pattern known as the wedge formation is similar to the symmetrical triangle. Both price patterns take approximately the same time to form and look very similar. Just like the symmetrical triangle, the wedge is made up of two converging trendlines which meet to form an apex. This intermediate pattern usually lasts more than one month but less than three.
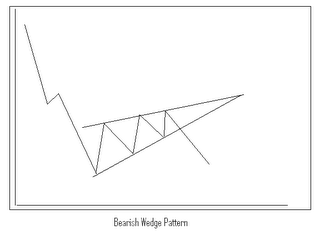
What is it that distinguishes the wedge from the symmetrical triangle since they are so similar? It's the noticeable slant to either the upside or downside. As a rule, the wedge slants against the prevailing trend. So a falling wedge in an uptrend is considered bullish, and the rising wedge in a downtrend is a bearish pattern. Notice in the graphs below, whether bullish or bearish, the slant is unmistakable.
Wedges are most often a continuation pattern found within an existing trend. However, they can, though much less common, occur at tops or bottoms signaling a trend reversal. Let's say a trader sees a clearcut rising wedge near the end of an uptrend. Since a continuation wedge should be slanting down, the rising wedge could be a sign of an impending bearish trend reversal. A falling wedge in a downtrend, the opposite usual, could signal a bullish trend onset.
Andy Swan is co-founder and head trader for DaytradeTeam.com. To get all of Andy's day trading, swing trading, and options trading alerts in real time, subscribe to a one-week, all-inclusive trial membership to DaytradeTeam by clicking here.


 Free Festival of Traders Videos