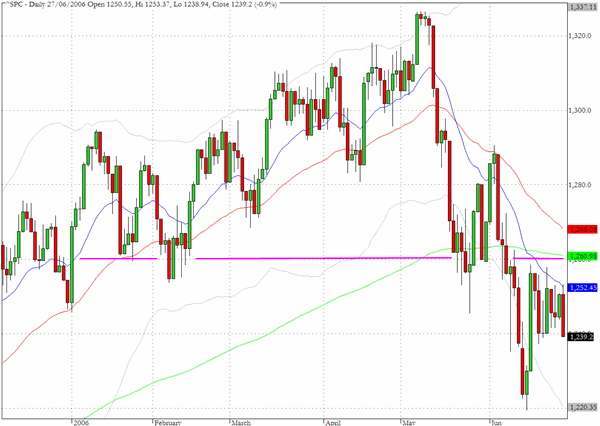
The range expansion arrived sooner than we anticipated. The inside days and triangular formations from the last few sessions seemed to be pointing toward a tighter range contraction prior to Thursday's FOMC decision. In their inimitable fashion the markets failed to deliver the expected and surprised many with a rather severe break back towards the lows from mid June. We had expected the S&P 500 to move back to the 1260 level during the course of this week (which we may still see) but if 1220 fails to provide support there could be another wave of selling ahead.
The chart for the Nasdaq Composite (IXIC) shows clearly the importance of the 2220 level which is where the index started 2006, the resistance level on the late May recovery rally and the level of the 200 day EMA. Yesterday's decline of 1.6% brought the index close to the mid June lows and more than five percent below the 2220 level.

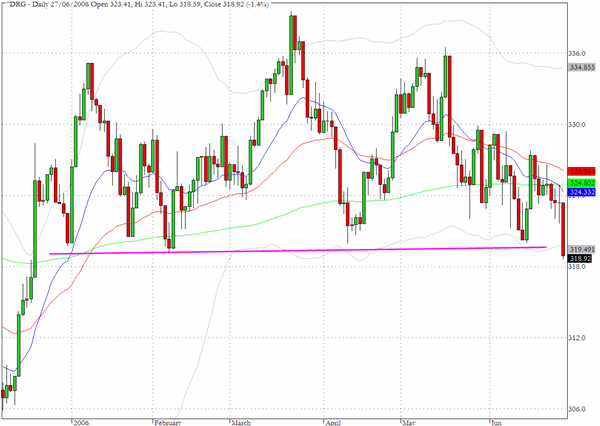
The AMEX pharmaceutical sector index (^DRG) produced one of the sharpest displacements from the pennant formations that have been building on many charts. The drop of 1.4% broke below the support line that has been in place since the beginning of the year and the index registered a new 2006 low.
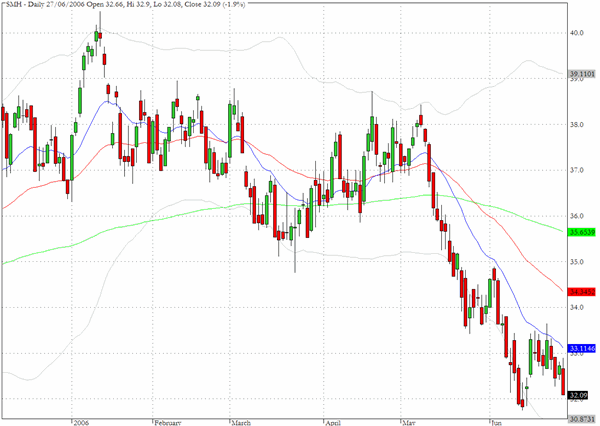
The semiconductor sector as represented by SMH closed very near to the June 13th closing low at 31.83. Since the early January spike which took the price up to $40 this sector has lost 20% of its value. As far as we can see there are no obvious signs of bargain hunting on the volume charts.
TRADE OPPORTUNITIES/SETUPS FOR WEDNESDAY JUNE 28, 2006
The patterns identified below should be considered as indicative of eventual price direction in forthcoming trading sessions. None of these setups should be seen as specifically opportune for the current trading session.
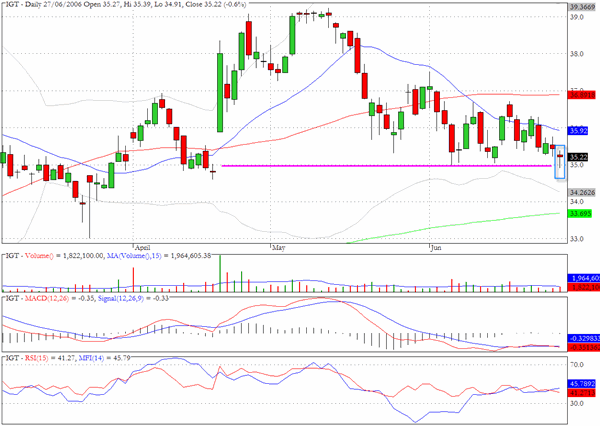
International Game Technology (IGT) recorded a narrow range Doji fomation at an area where some buying interest could emerge.
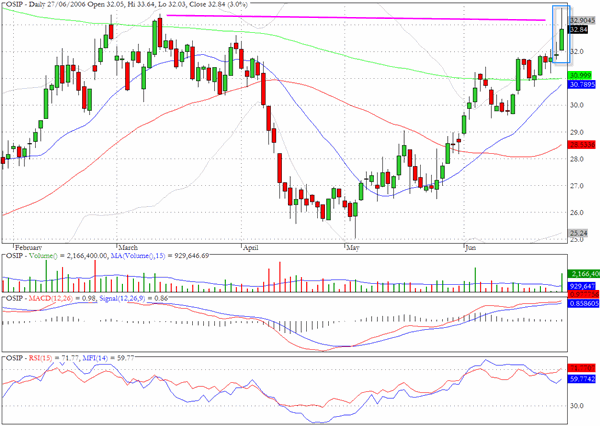
The chart for OSIP shows a Shooting Star formation on twice the average volume which coincided with the highs from March.
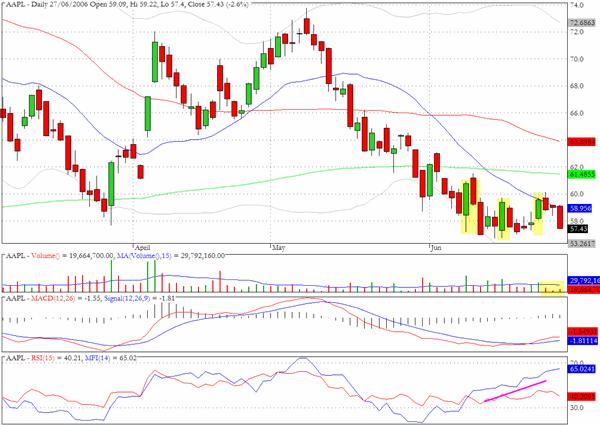
Apple (AAPL) fell 2.6% yesterday on modest volume. We have highlighted the recent above average volume sessions and each of them coincides with a green candlestick and the MFI chart reflect this fact.
Clive Corcoran is the publisher of TradeWithForm.com, which provides daily analysis and commentary on the US stock market. He specializes in market neutral investing and and is currently working on a book about the benefits of trading with long/short strategies, which is scheduled for publication later this year.
Disclaimer
The purpose of this article is to offer you the chance to review the trading methodology, risk reduction strategies and portfolio construction techniques described at tradewithform.com. There is no guarantee that the trading strategies advocated will be profitable. Moreover, there is a risk that following these strategies will lead to loss of capital. Past results are no guarante of future results. Trading stocks and CFD's can yield large rewards, but also has large potential risks. Trading with leverage can be especially risky. You should be fully aware of the risks of trading in the capital markets. You are strongly advised not to trade with capital you cannot afford to lose. This article is neither a solicitation nor an offer to buy or sell securities.