Good Morning, Traders. The market is still jittery and rather flat ahead of the Fed annoucement. The major averages rose a bit, but not enough to clear Tuesday's highs. Although there was a slight push below Tuesday's lows, the majority of the price action was within the prior day's range giving us another inside day. This lack of volatility and failure to break definitively out of range is typical in the week ahead of an FOMC announcement on interest rates. The FOMC started its meeting yesterday and will come out with a decision at 2:15 pm ET today. Should be a doozy as it's one of those meetings where traders, investors, and various economic pundits are seriously split as to whether we get a quarter or a half this time. Expect the usual gyrations in the $SPX at post time.
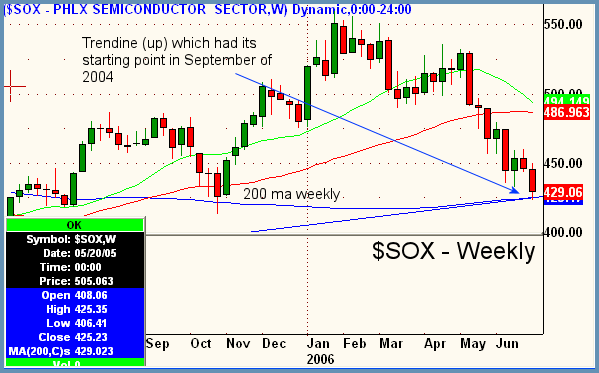
Going forward in the markets a bit, keep an eye on the Philadelphia Semiconductor Index for the rest of the week and next. Although I am not advocating taking any positions ahead of the Fed, the recent action in the chip index should not be ignored. Having now sold off for almost eight full weeks in a row, the $SOX has come into two major areas of support. The first being a rising 200-period weekly moving average, and the second being a rising trendline which has been in place since September of 2004. Although the semis are rather oversold and extended from the 20-period moving average (green) on the below weekly, it would make sense that semis probably correct by time rather than price here, or even move lower, breaking their long-term trend because so far in 2006, the index has been relatively weak all year. One need to only overlay the chart above with a weekly of the $SPX to see that the semis failed to make new highs in lockstep with the S&P and broke down far earlier in the year. Look to the $SOX as another market internal indicator that often leads price action in the Nasdaq Composite and then in the broader market.

Peter Reznicek is the Chief Equity Strategist and a principal of the Prana Fund, a domestic hedge fund, and ShadowTrader, a subsidiary of thinkorswim which provides coaching and education to its clients on both intraday and swing trading of equities. For a free trial to the full version of The Big Picture or to learn about ShadowTrader's other services, visit shadowtrader.net or send an email to preznicek@shadowtrader.net.