NASDAQ Commentary
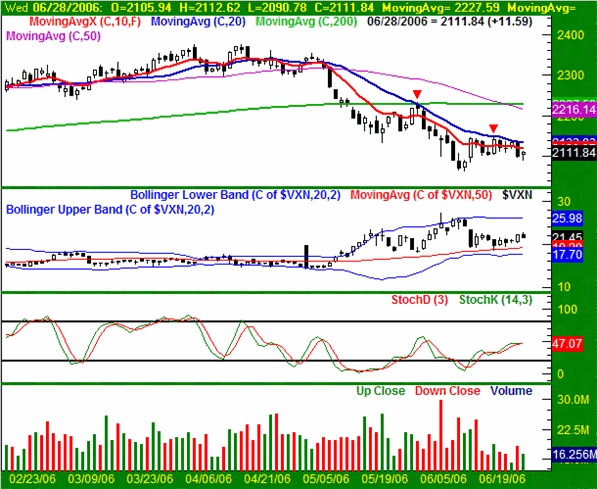
After gaining 11.59 points (+0.55%) on Wednesday, the NASDAQ Composite is only 9.63 points in the red for the week (-0.45%). The main culprit behind Tuesday's big loss was resistance at the 20 day moving average line, as we discussed in Saturday's Weekly Market Outlook. So, despite the partial bounceback, the index is still on the bearish side of the charts. Of course, the Federal Reserve meeting and interest rate announcement will only stir the pot a little more.
Everything really hinges on what the Fed says today, but we do want to go over the key support and resistance levels the NASDAQ is facing right now. The 20 day line has been the problem level for weeks now. Unless the NASDAQ can actually close above it (it's at 2135), we won't really care what the Fed says. Only a close above that line would convince us that the composite is really pointed higher. On the flipside, we'll set support at 2065, where the NASDAQ hit lows for the year just a few days ago.
And as evicdence that things are on hold for the Fed, just take a look at volume. It's dropped off the face of the earth this week (both bullish and bearish). There's just nothing to say until after today...the NASDAQ isn't even dropping hints about how it's going to respond to the Fed.
NASDAQ Chart

S&P 500 Commentary
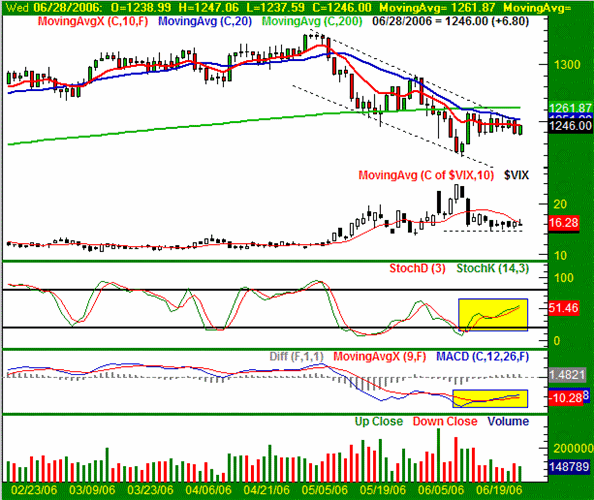
The S&P 500 matched the NASDAQ's gain on Wednesday with a 0.55% (+6.8 points) of its own. And as of now, it's actually up for the week...by 1.5 points (+0.12%). It's not much, but hey - a gain is a gain. Truth be told, with trading essentially on hold right now until we hear Bernanke speak on Thursday, we're not surprised stocks are flat, yet choppy.
The one problem we discussed in Saturday's Weekly Market Outlook for the SPX wound up being the one thing we needed to worry about...the upper resistance line of he bearish channel. The S&P 500 hit it, and has pulled back since then. Yet, every other piece of this chart is bullish.
Take a look at the CBOE Volatility Index (VIX). Although it still hasn't broken under support at 14.90, it keeps knocking on the door. Yesterday's open and close for the VIX was at the lower end of the daily bar, which suggests pressure to send it lower, and is therefore bullishfor stocks.However, it hasn't panned out that way just yet. Plus, the bullish MACD crossover as well as the recent stochastic buy signal are both still intact, so we have to respect the indications, and interpret them as they stand.
However, like the NASDAQ, there are some key moving average lines that are acting as resistance. Seeing as how we're so close to them, it's prudent to wait for a couple of closes above them before counting on the bullish hints to actually get some traction. The highest of them is the 200 day line, at 1262, so we'll make that the make-or-break point.
S&P 500 Chart

Dow Jones Industrial Average Commentary
The Dow only managed a 0.45% gain (+49 points) on Wednesday, leaving it in the red by 15 points (-0.14%) for the week so far. As far as we're concerned, that's even. It's also pretty clear that the Dow's not going to budge until Bernanke says his piece. No chart this week.
Price Headley is the founder and chief analyst of BigTrends.com.