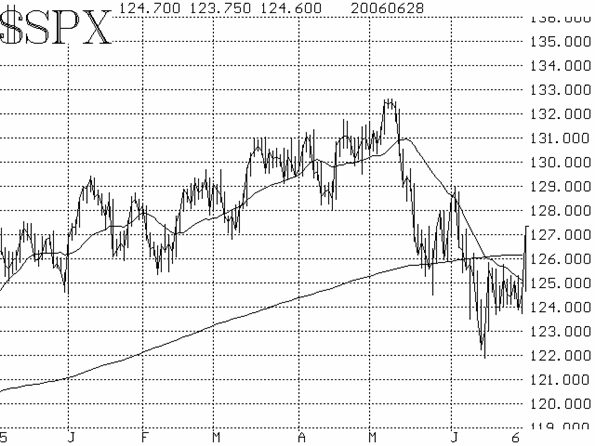
We have been waiting for the market to break out over resistance -- to show that price action could be as bullish as some of the technical indicators were becoming. That has now occurred, in the wake of the Fed's announcement. I'm not completely in agreement with the super-bullish interpretation of the Fed statement (and I think some of the buying was due to end-of-quarter window dressing), but the reasons don't really matter. An upside breakout has occurred and thus we expect the major indices to trade higher at least for the short term.
$SPX had struggled with the 1260 area. Two rallies were turned back there, and the 200-day moving average (one which is often followed by institutional traders) had been holding back progress as well. In addition, the declining 20-day moving average was overhanging the averages as well. Today's rally blew through all of those, turning the technical picture bullish -- at least as long as it doesn't slip back below 1255, say.

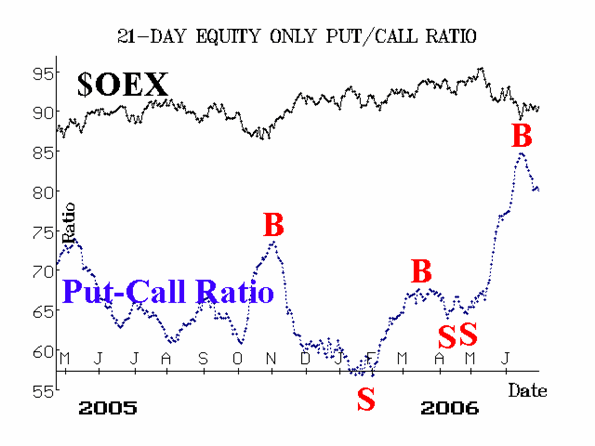
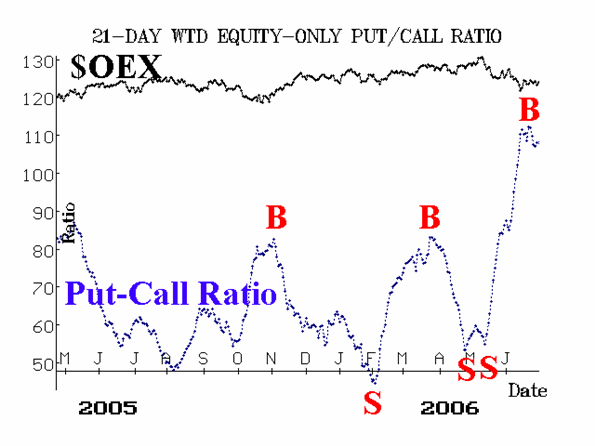
The equity-only put-call ratios had already turned bullish (Figures 2 and 3) and were just waiting for confirmation from price action and the other technical indicators -- confirmation which is now verified.


Market breadth has been poor all year, and it was deeply oversold for most of the past month. With today's action, both breadth oscillators have given buy signals. A truly long-lasting rally would be led by extremely oversold breadth readings in the coming days and weeks. Failure to achieve that may give us some indication of just how strong and long-lasting this rally can be.
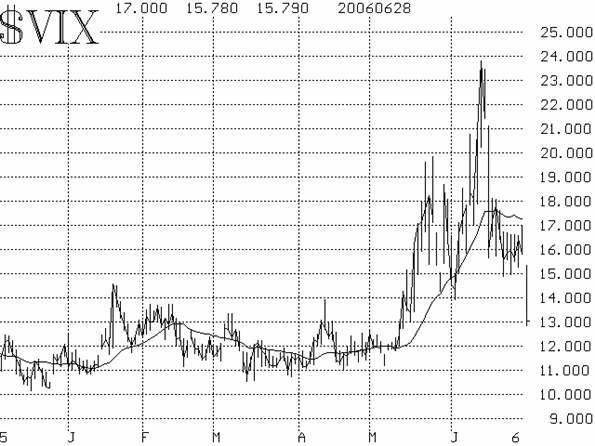
Volatility indices ($VIX and $VXO) plunged today. That is a bit strange, because a new era of higher volatility has almost certainly been issued in. Even if the Fed has temporarily stopped raising rates, the market is going to live in fear that they might start again. That, coupled with the aftermath of a very nasty decline in April and May is certainly going to keep volatility high, in our opinion. Yes, we understand that $VIX dropped because put sellers were hammering $SPX and $OEX puts with abandon today, but that doesn't necessarily mean the market won't be volatile.

This short-term breakout should carry the averages up to at least the early June highs -- about 1290 on $SPX. The jury is still out on what happens after that. It is possible that an intermediate-term rally will take place, but we are not jumping on that bandwagon yet. The June lows are eventually going to be retested, we're sure, even if it takes several months to do so. This could develop into the kind of bottom we saw in August-October 1998 or July-October 2002. But, for now, enjoy the rally while it lasts.
Lawrence G. McMillan is the author of two best selling books on options, including Options as a Strategic Investment, recognized as essential resources for any serious option trader's library.