NASDAQ Commentary
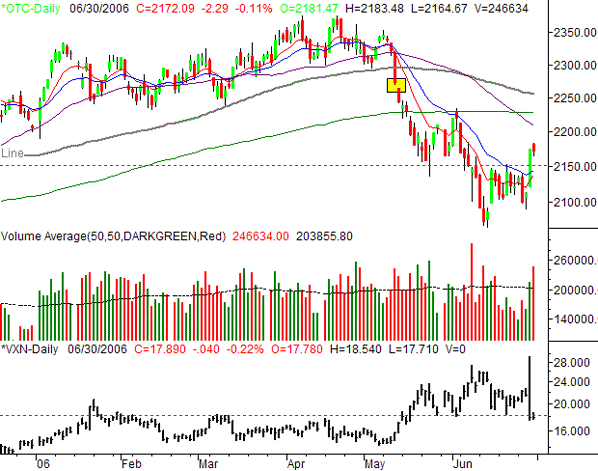
The NASDAQ led the way last week with a 2.39% gain. Friday's close of 2172.09 was 50.62 points better than the prior week's close, and a lot of technical resistance was knocked down, including the 10 and 20 day moving averages. As such, the path to further gains has at least partially been cleared.
Aside from the close back above the 10 and 20 day lines, we also broke resistance at 2150. The composite had made a few attempts at getting and staying above that level once we fell under it on June 8th. However, we couldn't muster it...until now. Thursday's 62 point gain pushed the index well past that mark, and Friday's mild pullback didn't even come close to wiping away that bullish swing from the day before.
Simultaneously, the CBOE NASDAQ Volatility Index (VXN) broke under a support level that mirrored the NASDAQ's resistance at 1250. The VXN had not been able to move under 18 since moving above it in mid-May. On Friday, it closed at 17.89...pretty much where it closed Thursday as well. It's an indication that the market is relatively comfortable with the idea of stocks going higher. Of course, that's one of the required ingredients for a move higher.
From here, we think enough foundation has been laid to force the NASDAQ even higher. We don't want to get too euphoric with our target, though. Ultimately, a retracement up to this year's highs near 2375 is possible. However, we'll set 2225 as our first checkpoint. That's right between the 50 day line and the 200 day line. Once there, we'll re-assess.
NASDAQ Chart

S&P 500 Commentary
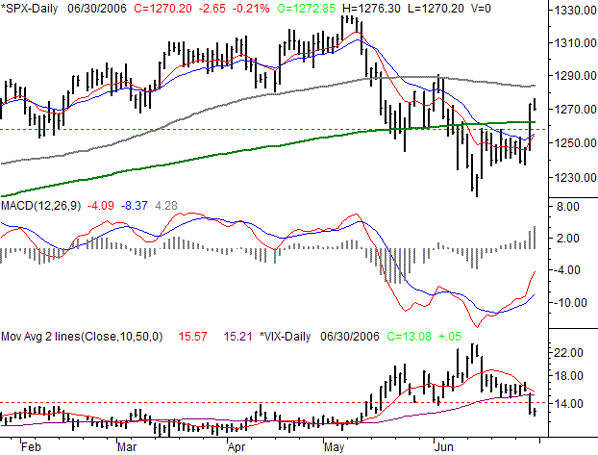
The S&P 500 didn't do quite as well as the NASDAQ did last week, only gaining 2.07%. This large-cap index gained 25.7 points to close at 1270.20. Like the NASDAQ, the 10 and 20 day moving average lines were crossed, but for the SPX, another key line was crossed as well - the 200 day average. This suggests a bigger-picture recovery move has begun.
There's really not a lot to add here; the SPX basically passed the same milestones as the NASDAQ did. And, the CBOE S&P 500 Volatility Index (VIX) mirrored the NASDAQ's VXN.
The only major (potential) resistance line left for the S&P 500 is the 100 day line, at 1283. The 100 day average usually isn't a factor, but it became one in recent months when it prompted bounces after brief pullbacks. It became an even bigger issue on June 2, when it sent the S&P 500 to what ended up being new lows for the year. So while we're bullish, we'll rest much easier once it's crossed.
The VIX's recent action adds to the bullishness of the chart. Friday's low of 12.74 was a six-week low.
On top of all that, we have a recent MACD crossover, which we're going to take at face value.
When and if the 100 day line is crossed, we'll set a target of 1326 for the SPX. Support is at 1258. That's where the S&P 500 recently crossed resistance, and it's about where the 10 and 20 day lines will be by the time we see any retest near that area.
S&P 500 Chart

Dow Jones Industrial Average Commentary
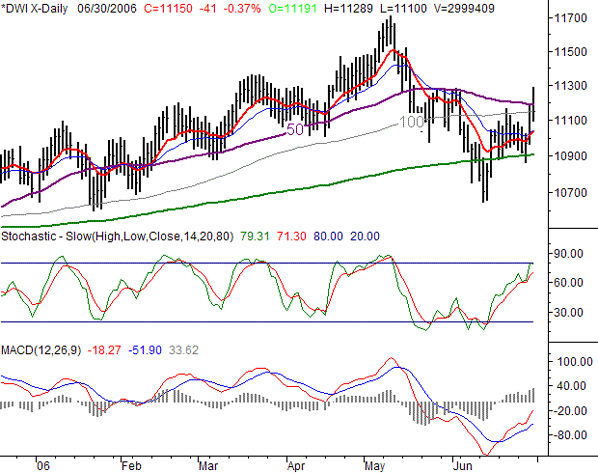
The Dow trailed the other two indices last week, for the first time in a long time. The 161 point gain translated into only a 1.47% improvement over the prior week, leaving the blue-chip index at 11,150 by the end of trading on Friday. But still, a lot of resistance was breached.
That close was right at the 100 day line, and Friday's high of 11,289 was well above the 50 day average. Past that, it's smooth sailing for the bulls. So while the Dow had the least impressive week, it also had the least room to recover. If we can muster a close above the 50 day line at 11,187. Once done, a move up to this year's high of 11,709 isn't out of the question. Support is at 11,041, where the 10 and 20 day lines are parked.
We've also added a stochastics chart to our Dow graph, just to illustrate a point. Although we're very near 'overbought' levels, that's not necessarily a signal to plan on a big pullback. It's quite possible for the Dow to stay overbought for a while, and move higher the entire time - much the same way it stayed oversold for most of May.
Dow Jones Industrial Average Chart

Price Headley is the founder and chief analyst of BigTrends.com.