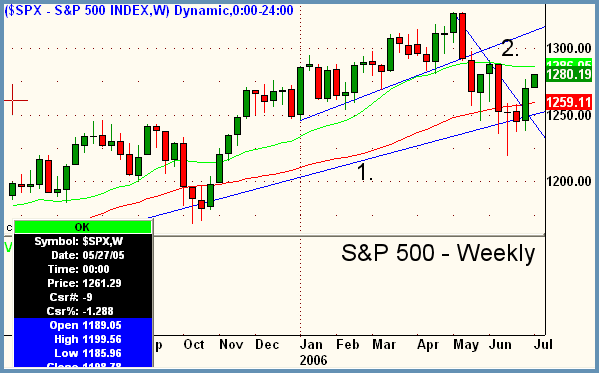
Good Morning, Traders. It was a half day in the markets on Monday, which resulted in more gains as the market possibly shifts gears to reclaim some of the May-June losses. It's hard to tell at this juncture if we are switching direction or not in the overall picture. The Nasdaq Composite remains the thorn in the side of the S&P and Dow, both of which have now broken near-term downtrend lines and have some clear air above their current levels where they could run at least slightly higher before hitting more serious resistance. Internals were decent in the abbreviated session on Monday, with strength in mining stocks and broker-dealers leading the way upward. Overall volume was extremely light as expected with less than a billion shares traded on each exchange. Going forward, the below chart of the weekly S&P can give us an idea of where we stand currently in the "Big Picture." The lower blue ascending trendline (1) is the main trend of the SPX that is still for the most part intact, keeping in mind that the recent approach downward to this trendline over the last two months has been on very large volume on the downside, indicating that institutional investors were selling it. Now, after a false break down below the 1250 area we have seen a one-week-and-a-day bounce towards two key resistance points above. The first is the green line 20ma at 1286 and the next is the backside of the 2006 ascending trendline (2) which is the upper ascending blue line. Note as well, that even without marking up the chart, newly found strength going forward puts us closer to the middle of the entire 2006 range, which would shift the overall bias from down to sideways at best. Although ready to change my mind on a dime if proven wrong, I am of the opinion that the 1300 resistance will hold going forward and that sellers who wish to make themselves whole again from the decline of the last two months will creep back into the market. In the near term, bias is not as clear now, so trade accordingly, committing less or nothing to positions until the market shows its hand.

Peter Reznicek is the Chief Equity Strategist and a principal of the Prana Fund, a domestic hedge fund, and ShadowTrader, a subsidiary of thinkorswim which provides coaching and education to its clients on both intraday and swing trading of equities. For a free trial to the full version of The Big Picture or to learn about ShadowTrader's other services, visit shadowtrader.net or send an email to preznicek@shadowtrader.net.