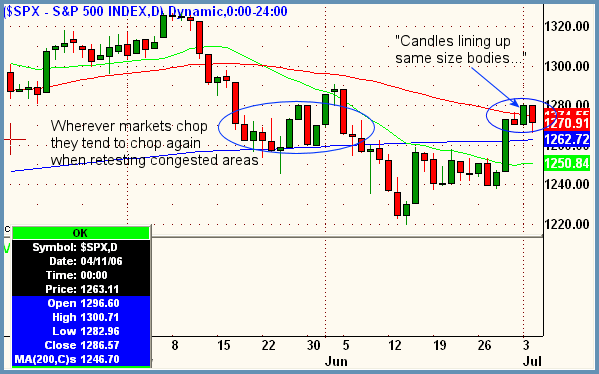
Good Morning, Traders. Little to report on the first day back of the new quarter other than the fact that the small gain from Monday's abbreviated session got wiped out, pushing the markets back to the top area of the post Fed rally. What's more important is what happened under the hood as we say "internally." Breadth and advance decline lines closed very weak indicating stronger selling than the aforementioned figures would imply. On the Big Board, declining volume outpaced advancing volume by a ratio of over three to one, and on the OTC it was over six to one. Similarly, declining stocks led advancing stocks by 1500 and 1121 respectively on those two exchanges at the close. The Nasdaq trin confirmed the selling, closing above 2.7 indicating sellers taking control at the close. Only oils were able to hold up with the rest of the my Core Sector List in the red. The chart below shows that technically very little has changed, with yesterday's daily bar simply creating the "candles lining up, same size bodies" phenomenon that I discuss often. I maintain that the 1300 will be the level to watch going forward. So far no change as we trade on in the holiday shortened week. We may stay in a holding pattern until payroll figures drop on Friday morning. Hold tight.

Focus List
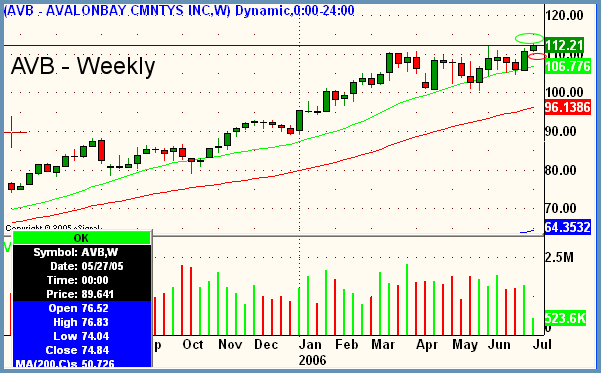
AVB - Avalon Bay Communities
Industry - REIT (Apartments)
Side - Long
Trigger - 109.00 - 113.00
Stop - 104.00
Target - 120.00+
Timeframe - multiweek to multimonth
Notes
- As long breakouts are difficult in this environment, trigger price has been listed as an area of accumulation with a firm stop under swing lows.
- It's ok to break up entries but generally never ok to play loose with stops.
- Stock has just moved a hair over weekly resistance after five days up, therefore some minor correction may ensue in this area which would be a buying opportunity down to about 109.00.
- Fundamental picture improving for this sector as residential housing continues to be under pressure, which is more than likely the catalyst for the relative strength in this stock which is making new all time highs when the market is not.

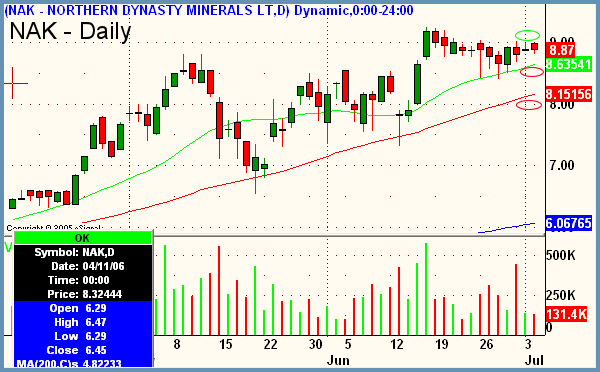
NAK - Northern Dynasty Minerals
Industry - Metals & Mining (Gold)
Side - Long
Trigger - 9.10
Stop - 8.50 - 8.00
Target - 11.00+
Timeframe - multiweek to multimonth
Notes
- Bullish pattern on all timeframes.
- Stop listed is under 20ma daily, but this stock will more than likely chop around in the near term and possibly have a few fits and starts before the breakout holds, due to correlation with spot prices in metal.
- Focus List prefers accumulation between $8 and $9 in anticipation of longer term larger move over one purchase, one sale on mining stocks.

Peter Reznicek is the Chief Equity Strategist and a principal of the Prana Fund, a domestic hedge fund, and ShadowTrader, a subsidiary of thinkorswim which provides coaching and education to its clients on both intraday and swing trading of equities. For a free trial to the full version of The Big Picture or to learn about ShadowTrader's other services, visit shadowtrader.net or send an email to preznicek@shadowtrader.net.