The S&P 500 retreated from the pivotal 1280 level in yesterday's session. The index lies at an interesting juncture having closed above all three of its moving averages and in the "twilight" zone betweeen 1260 and 1280. In Monday's abbreviated session, the path of least resistance allowed the index to close at exactly 1280 and we sense that this will become the target threshold for the bulls in today's session but with the release of key economic data tomorrow we may see an attempt to test the nerves of anxious traders closer to the 1260 level.

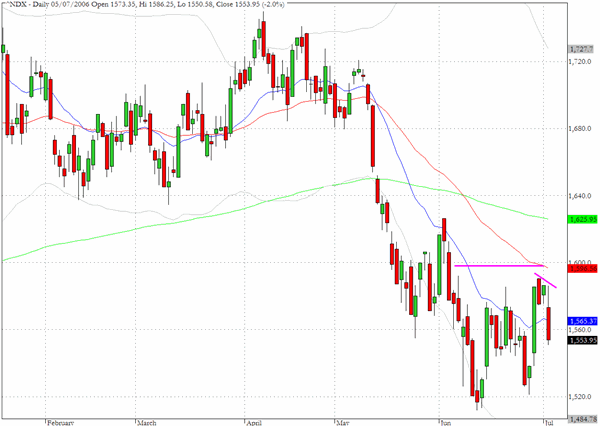
The Nasdaq 100 cash index dropped more precipitously yesterday and registered a 2% decline for the session. The index confronts two signficant hurdles on the upside, one is the area of price congestion around 1600 and above that is the 200-day EMA at 1625.
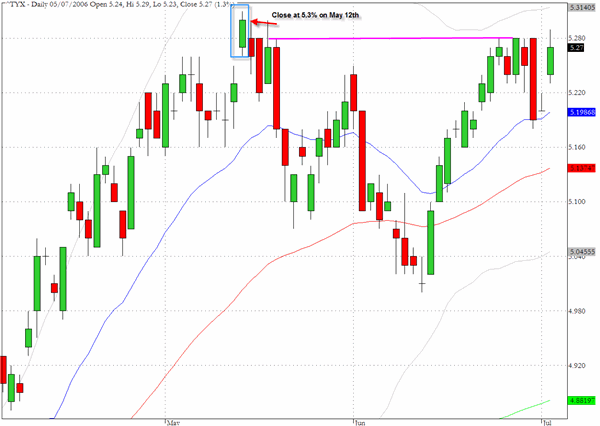
The chart for the yield on the thirty year bond (^TYX) reveals that this longest dated maturity is at a potential breakout level. Its highest recent close (since 2004) was at 5.3% on the May 12 and in yesterday√Ę‚,¨‚"Ęs trading the yield touched 5.29%. The yield on the ten year note also closed within a whisker of a multi year high. The capacity utilization concerns that often accompany employment reports could surface in the next few sessions and could see us break above the recent yield ceiling.
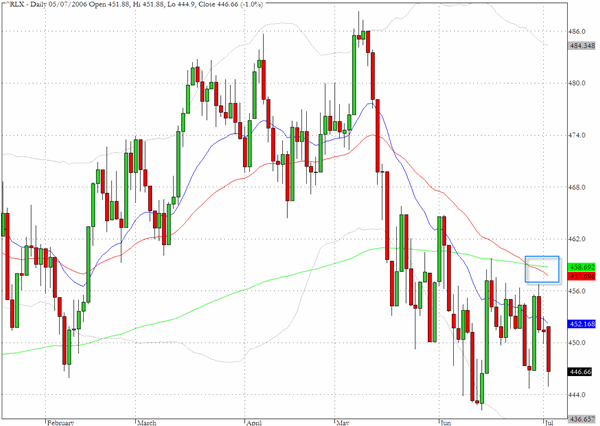
In comparison to the chart for the S&P 500 and even, to a lesser extent the Nasdaq 100, the chart for the retail index (^RLX) seems to be gravitating towards a retest of its recent lows. The intersection of the 50 and 200 day EMA's will also act as an inhibitor to any moves to the upside.
TRADE OPPORTUNITIES/SETUPS FOR THURSDAY JULY 6, 2006
The patterns identified below should be considered as indicative of eventual price direction in forthcoming trading sessions. None of these setups should be seen as specifically opportune for the current trading session.
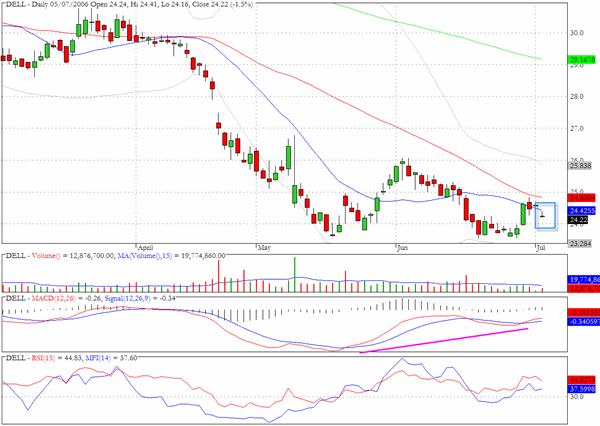
Dell (DELL) registered a tiny Doji candlestick which was also an NR7 formation. The momentum divergences are pointing to basing pattern that may be close to completion.
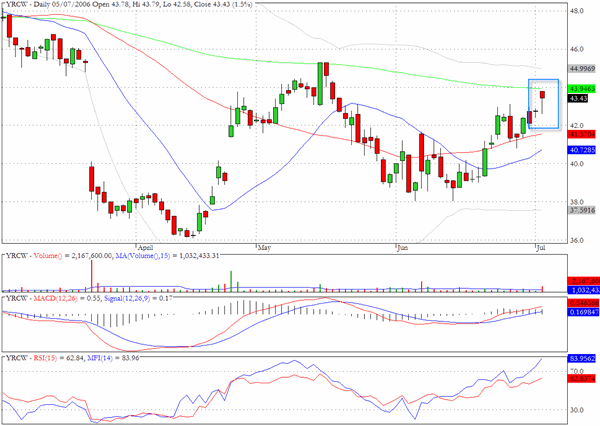
YRCW recorded a Hanging Man candlestick just below the 200 day EMA on twice the average volume. We would not be surprised to see a temporary retreat.
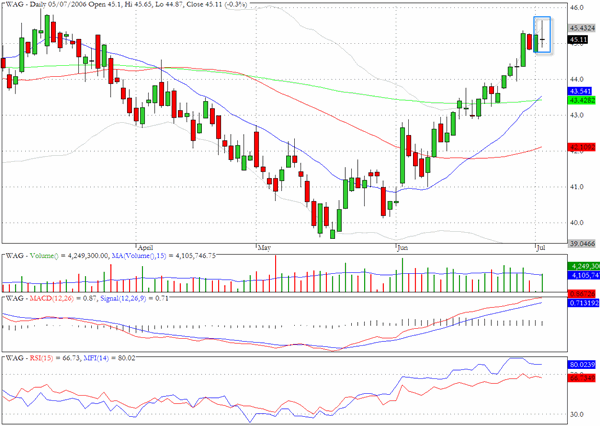
Walgreen (WAG) has also reached a level where there may be some short term difficulties in acheiving further price appreciation.
Clive Corcoran is the publisher of TradeWithForm.com, which provides daily analysis and commentary on the US stock market. He specializes in market neutral investing and and is currently working on a book about the benefits of trading with long/short strategies, which is scheduled for publication later this year.
Disclaimer
The purpose of this article is to offer you the chance to review the trading methodology, risk reduction strategies and portfolio construction techniques described at tradewithform.com. There is no guarantee that the trading strategies advocated will be profitable. Moreover, there is a risk that following these strategies will lead to loss of capital. Past results are no guarante of future results. Trading stocks and CFD's can yield large rewards, but also has large potential risks. Trading with leverage can be especially risky. You should be fully aware of the risks of trading in the capital markets. You are strongly advised not to trade with capital you cannot afford to lose. This article is neither a solicitation nor an offer to buy or sell securities.