NASDAQ COMMENTARY
After Monday's big rally, a lot of folks were convinced that the NASDAQ was going to break out of this rut and moving on to new highs again. Over the last day and a half, though, those investors have learned that it pays to be skeptical. For the week so far, the index is down by 18 points (-0.9%), and still pointed lower. True, it's possible that stocks could make a quick recovery and start to head upward again, but the NASDAQ's chart says that's pretty unlikely.
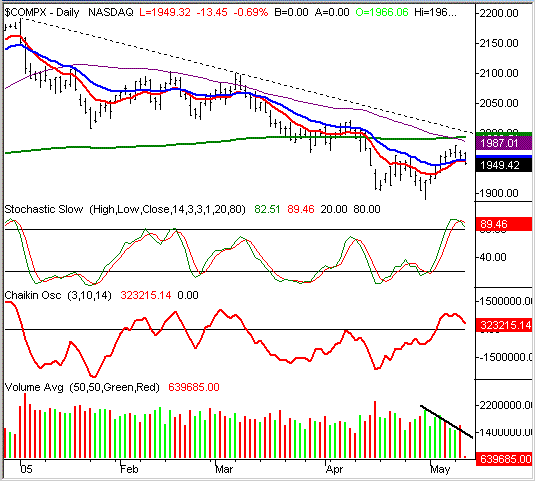
We've really zoomed out on today's chart to show you why this weakness isn't really a surprise at all. In a nutshell, the composite has been trapped under what is now a long-term resistance line (dashed) since the beginning of the year. Additionally, the composite has been unable to cross back above the 50 day moving average line (purple). And as of April, the NASDAQ is also under the 200 day average (the grand-daddy of all the key moving averages). It looked like we might see a retest of both of those key averages later this week, but after today, even that doesn't seem likely. Instead, the composite is driving down into the short-term averages again - the 10 and 20 day lines. That's bearish, but what we find even more concerning isn't really on most people's radars. See the 50 day line falling under the 200 day average (green)? That's the first time this has happened since November, when the market finally pulled itself up by the bootstraps. It's just a sign that the intermediate-term momentum (weekly) is aligning with the long-term (monthly) momentum......and both are bearish. That's why we've stayed in the bearish camp for the past few weeks, even when it seemed like stocks were ready to rally.
And now, the pressures of being oversold - along with a limited number of buyers - is being felt. Both stochastic lines crossed above 80 as of Monday, leaving the index 'ripe' for some profit-taking. It is possible that the market can stay overbought for extended periods, but we haven't seen that happen once this year. So, based on recent history, we had to be a little suspicious when it happened this time around. Out other red flag was the fact that the number of buyers (as in volume) was shrinking. The bulls managed to six of the last eight days, but it wasn't a case where the number of buyers was growing. As you'll see on the bottom of our chart, the amount of buying volume was pretty much shrinking the entire time......it's just that there were (literally) few, if any, sellers to contest that buying. But as of yesterday, it looks like the sellers are back at work. Yesterday's selloff was on higher volume, and today's selling has been strong enough to pull the NASDAQ back under the 10 day average again.
We don't have the second close under the 10 day line (or even the first one, for that matter) to serve as the confirmed sell signal. But, we think we'll get it. Once we do, odds are that the chart pattern we've seen most of the year will play out again. That means a fall of approximately 80 points from current levels, or four percent. That will draw the NASDAQ close to 1870 for this particular leg. But the key to getting that confirmed sell signal will be another close back under the 10 day line; we'd need to see it happen by the end of this week to keep this downside momentum in place.
NASDAQ COMPOSITE CHART

S&P 500 COMMENTARY
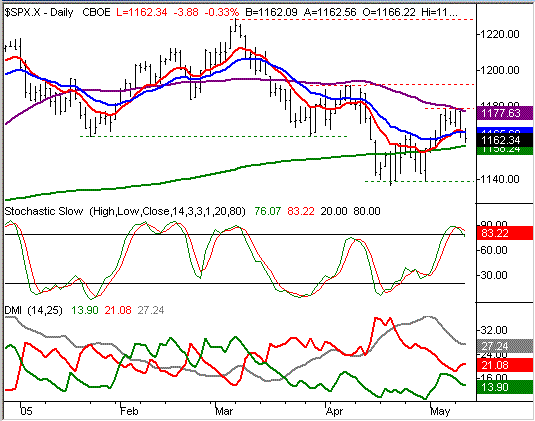
The S&P 500's woes are slightly different than the NASDAQ's, although they're no less bearish. The problem are for the SPX is clear - the 50 day line (purple) held up as a resistance level, pushing the index lower after the last few days were spent trying to breach it. This is the second time we've seen this happen this year. The first time was in late March, which is why we wanted to wait and see if the market could work past this line with this attempt. Well, it couldn't. As a result, the S&P 500 is now back under the 10 and 20 day averages too, just like the NASDAQ. Like the NASDAQ, being stochastically overbought was the beginning of the end for the rally.
The one striking difference here is that the S&P 500 is still above its 200 day average (green). It's currently at 1158, and with the index floating around 1162, some bulls are still clinging to the hope that support will be found there. Considering that it really didn't hold as support in April, we don't really have much reason to think that it will now, especially with all that resistance that we've seen piling up over the last few weeks. Not only are we under all the other key averages, but there's a pattern of lower highs and lower lows in place (see the red and green dashed lines).
As for where the S&P 500 might land, we'll have a little more faith in its resiliency. So, it's not quite as likely that this index will give up the same 4% that the NASDAQ potentially could. We expect to see some support at 1140, where we bottomed out in April. Part of this outlook is just based on technical analysis theory (where previous lows are likely to be retested). But, the idea has a little more weight since we saw the SPX make a double bottom at 1163 in January and March. History - and patterns - repeat themselves, so we'll set our initial target at the most recent low near 1140. We may reassess once we get there.
S&P 500 CHART

SPECIAL COMMENTARY - READER QUESTIONS
QUESTION: Mr Headley, I have a question regarding the $compq (NASDAQ) weekly chart: How far back should one go to suspect 1) double top and bottom or 2) two of three components of a head and shoulders move? This was, at first glance, my reaction to that (weekly) NASDAQ chart; it may have begun the middle of 2004 and is still in the making. What do you think?
ANSWER: We've thought about bringing this up on our weekly COMPX chart, but since it's still not clear yet, we just didn't want to jump the gun.
To answer your question, there is no answer. We've seen H&S patterns take months to set up, and we've seen them take days to set up. Likewise, we've seen H&S patterns set up huge moves, as well as minor moves. So, there is no 'typical' pattern or timeframe to look for. There's just something about (in the market) investors giving an index three chances. After the third failed try, they throw in the towel. The fact that it works in all timeframes is because it's NOT a conscious decision.....it's just the way investors think. And it works for multiple timeframes for a similar reason.....long-term pain and frustration sets up long-term moves. Short-term pain (or elation, or whatever) sets up short-term moves.
To answer your other question, we don't see a complete H&S pattern on the weekly COMP yet. But we do see a scary double-top in the making. If we break under 2004's low of 1750, then look out below.
Price Headley is the founder and chief analyst of BigTrends.com.