NASDAQ Commentary
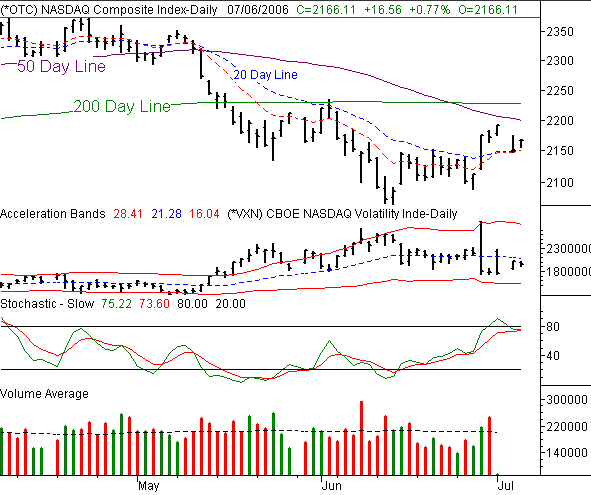
The NASDAQ is recovering pretty well today, up 16.56 points (+0.77%), and currently at 2166.11. But still, it's not enough to wipe away all of Wednesday's 40 point selloff. Although we're still in the red by 0.28% for the week, there are a couple of bullish clues that we have to respect.
Specifically, the 10 and 20 day moving averages have acted as support, both yesterday, and today. In fact, it was these short-term moving averages, currently at 2151, that stopped yesterday's slaughter, and provided a springboard for today's bounce. Considering that these two lines are probably our most foundational indicators, this is a big deal. After all, we've only been above the 20 day line (besides now) once in the last several weeks. This time around, we've managed to hang above it for five straight days. So, the bulls are fighting hard here.
So while things are still somewhat up in the air, we have to lean with the bulls at this time. The past couple of weeks have been generally bullish (albeit volatile), and some key technical progress is being made.
That said, as of right now, the NASDAQ Composite is sandwiched between a rock and a hard place. Support lies at 2151, where the 10 and 20 day lines are. Resistance looms ahead at 2200, where the 50 day line is resting. The fact of the matter is that we don't know what's going to happen when the 50 day line is approached - we haven't been close to it in weeks. Based on what we see right now, there's a distinct possibility that it could be crossed with no problems at all. However, we don't want to take that stand just yet. Plus, the 200 day line is waiting for us past that mark, at 2228.
Be patient here.
NASDAQ Chart

S&P 500 Commentary
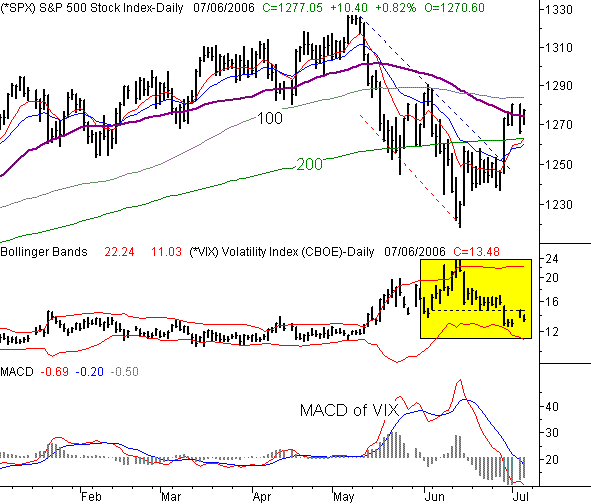
The S&P 500's 0.82% gain today is good enough to push it back above the 50 day moving average. The index is currently at 1277.05, up 10.4 points, while the 50 day line is at 1274. Needless to say, staying above that line will be a huge victory for the bulls. Be sure to check where we end the day.
It's also worth noting that the SPX has already closed above its 200 day line. In fact, the only potential problem area left is the 100 day line at 1284. Even then, it's only 7 points away, so if you're looking for concrete answers, you may not have to wait too much longer. And in the meantime, the momentum is with the bulls for this chart too.
We've been following the CBOE Volatility Index (VIX) closely here. For most of June, the VIX was finding support right around 15, which was a signal that any market rally was being stifled. Last Thursday, the support at 15 broke as the S&P surged on Bernanke's words. At the time, it looked like it was the beginning of a major upside move. In fact, it was a pretty nice bullish move, until Wednesday, when a North Korean missile test rocked the boat. The S&P 500 was sent south, and we're still in the red for the week because of it.
But look at the VIX. Despite all the selling, the VIX is still under 15, and still in its downtrend. Heck, one could even make the case that the VIX was now finding resistance at 15. Whatever the case, that falling VIX is why our bullish confidence is growing.
Support is at 1263, right where the 10 and 20 day lines have met the 200 day line.
S&P 500 Chart

Price Headley is the founder and chief analyst of BigTrends.com.