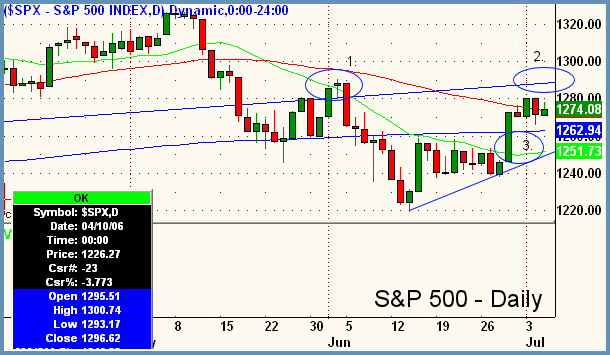
Good Morning, Traders. Yet another day of relatively contracted volatility on the dailies as traders and investors await today's payroll data set to drop at 8:30am ET. If you only looked at the Dow, it would appear that the market rallied hard yesterday, when in reality some favorable morning news for Dow component Altria (MO) pushed that component to the moon and dragged a number of stocks along with it. So while the Dow gained almost 74 points on the day, the S&P closed up just over 3 and the Nasdaq, which actually went red for portions of the afternoon (showing relative weakness as usual), gained just under 2. The core sector list was mixed at the close with strength in Coal and other mining stocks ($DJUSCL, $GOX) tempered by weakness in Oil Services ($OSX) and Software ($GSO). Breadth was split, which is the hallmark of an indecisive day with advancing volume beating declining volume on the NYSE but losing on the Nasdaq. Overall volume was light with less than 1.5 billion shares trade on the NYSE. Looking forward into the near-term as we like to call it, a case could be made that the next move in the very near future, ie: 2-3 days, could be upwards. Let's look at the $SPX daily chart to see how we've been acting since what I have been calling the "Post-Fed Rally" of June 29. As you can see from the chart below there has been a straight sideways consolidation by time and not price. Although we have not advanced much since that fateful Thursday, we haven't fallen back either. Overall volume has been light over the last few trading days as well (which would support the higher volume on the up, lower volume on the consolidation theory that we continue the prior move), although that could easily be attributed to the holiday weekend and the official beginning of summer doldrums when we expect total turnover to come in a bit. A breakout in either direction above or below the horizontal blue lines could have some meat to it as there is little near-term resistance in either direction. Above is the "open space" as we like to call it that may be filled to the next resistance area at $SPX 1300, denoted by points 1 and 2, and below is the advance of the Fed day rally (3) which was a straight up move that will offer no support on the way back down until the trendline at roughly 1250. So essentially, we remain rangebound for now with some pivots right near current price action that if breached will push prices to the more important pivots of +1300 or -1250 which will dictate the next larger move in the markets.

Peter Reznicek is the Chief Equity Strategist and a principal of the Prana Fund, a domestic hedge fund, and ShadowTrader, a subsidiary of thinkorswim which provides coaching and education to its clients on both intraday and swing trading of equities. For a free trial to the full version of The Big Picture or to learn about ShadowTrader's other services, visit shadowtrader.net or send an email to preznicek@shadowtrader.net.