NASDAQ Commentary
The NASDAQ was all over the map last week, hitting a high of 2190.44, and a low of 2126.64, before settling into the close at 2130.06. That was 42.03 points (-1.9%) below the previous week's close. And more than that, things ended on a sour note, or heading lower. Yes, the composite is in some serious technical trouble again.
At this time last week, we were talking about some bullish hints from the NASDAQ's chart. But, a missile test in North Korea started a selloff that ended up snow-balling into something pretty rough. The composite fell back under its 10 day moving average, and is pressing into the 20 day line as of Friday's close. The volume behind the move wasn't higher than usual, but it wasn't weak volume either. As of right now, the bears have the momentum.
Plus, the CBOE Volatility Index (VXN) is back on the rise. After hitting it's lower band line two Friday's ago, support was found, which pushed the VXN from 17.89 to 20.17...with more room to go higher. The VXN's upper band line is at 25.58, and based on the way it's been ranging between those bands, there's a real possibility the VXN could end up retesting the 25 area. If it does, it will coincide with weakness for the NASDAQ.
The other side of the coin, though, is this...we're still above the 20 day line, and it's not clear if last week's bearishness will persist. It was mostly caused by a combination of geopolitical worry, and choppiness associated with summer months. We don't want to count it out yet, even though the chart looks a little ugly right now. If the 20 day line fails to act as support, and/or if the VXN creeps higher, then it will be easier to justify a cancellation of our prior bullish stance and the issuance of a bearish one. Stay tuned - we may have our answer by Wednesday's mid-week update.
NASDAQ Chart

S&P 500 Commentary
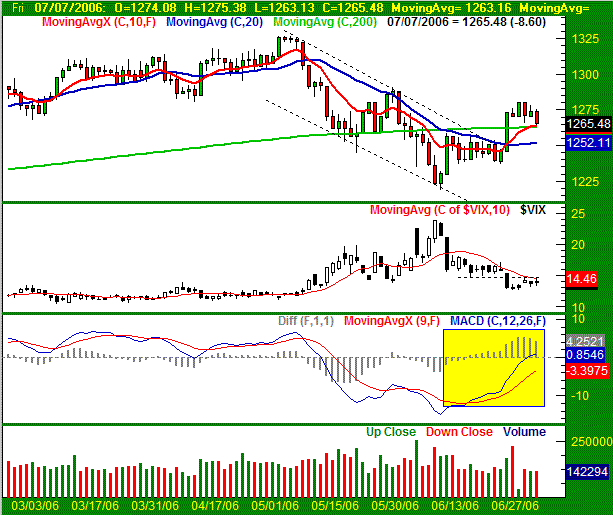
Despite the bearish Friday, the S&P 500 only gave up 0.37% last week. The close at 1265.50 was just 4.7 points under the previous Friday's close, and perhaps more importantly, NOT under some key support levels. The bulls still need to do some work if they hope to survive, as the momentum is clearly to the downside. But, they'll at least have the help of long-term and short-term moving averages.
In fact, from a technical perspective (and unlike the NASDAQ), the SPX is still in an uptrend. The 10 and 200 day lines that were crossed on the 29th of last month are actually acting as support now. Both are currently at 1263, which also happened to be the low for the week (from Friday). And like we said, the S&P 500's loss was week was minimal.
What's interesting here is the CBOE S&P 500 Volatility Index (VIX). Unlike the VXN, the VIX isn't really moving higher with any conviction. It gained only 0.89 points last week, ending Friday at 13.97. More than that, where the 15 area had been support, it's now acting as resistance. For that matter, the VIX's 10 day average is also acting as resistance, so we can't be too quick to say the VIX is header higher. It's obviously not going lower, but at this point, we can't get bearish on stocks based solely on the VIX. So, unlike the NASDAQ, the SPX isn't fighting an uphill battle.
All the same, we do have a lot of bearish concerns. In fact, we went officially bearish in our market timing model that paid subscribers receive. The model is based on some proprietary indicators, but it als has a lot to do with the NASDAQ's relative underperformance. The NASDAQ usually leads the market (both up and down). Seeing it do so poorly last week, we have to think it will begin to be a drag on the rest of the indices soon. We reserve the right to cancel that stance at any time, but n general, it's an accurate indication of what's in store...despite the S&P 500's generally bullish chart.
S&P 500 Chart

Dow Jones Industrial Average Commentary
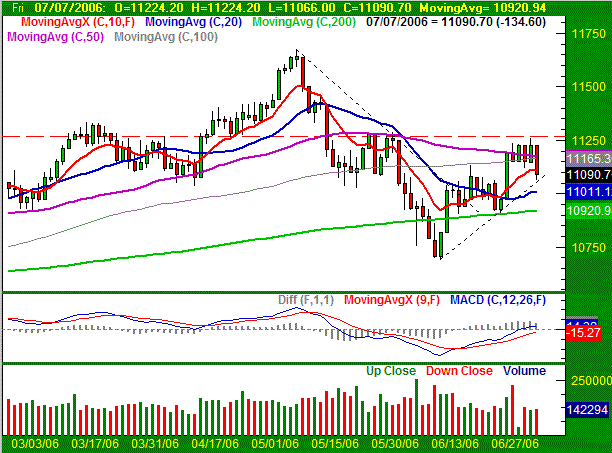
Had it not been for 3M's (MMM) 9% selloff on Friday, the Dow may not have lost the 1.2% that it did, and the blue-chip index would have once again been the strongest index (on a relative basis). But, thanks to 3M, the Dow lost 0.53% (-59 points) for the week. It ended at 11,091 on Friday and under a couple of critical moving averages.
For a few days, it looked like the Dow might topple the 50 day line...the last of the key moving averages standing in the way of a breakout move. But, as of Friday, we're back under it. We're also back under the 10 and 100 day moving average lines. All of them are bearish omens.
However, there is one last bastion of hope for the Dow bulls. After hitting this year's low of 10,698.90 on the 14th, straight-line support has been established by three distinct lows (one of which was Friday's low of 11,066). It's the upward-sloping dashed line on our chart. It's partially significant, but we don't expect it t be a major factor in any decision the bulls may make about staging a rally now. The more important support line is the 20 day line, at 11,011. As for resistance, it's at 11,280. That's (roughly) the area where the Dow began to struggle after two of the last three rally efforts.
In the meantime, the Dow is a above the 200 day line, currently at 10,920. That's bullish. However, the bulls faded quickly last week, and set some mild bearishness into motion. We still think the Dow will lose the least in a broad market selloff, but a loss is still a loss. We wouldn't expect to see the Dow move any lower than the 200 day line though. If resistance is broken at 11,280, the bearish view will be retracted, as it will probably indicate a bullish breakout.
Dow Jones Industrial Average Chart

Price Headley is the founder and chief analyst of BigTrends.com.