The bounce off of this year's low point in early June has produced two of the largest up-days the market has seen in several months. I view this as the beginning of a corrective period that is an opposite response to the strong wave of selling that hit the markets in May.
Corrective environments are likely to take as long, if not longer, than the preceding trend, and so it looks as if the market is going to quiet down for at least another two weeks, where it will once again be vulnerable to another wave of selling later in July at the least.
Let's take a look at what this corrective behavior (or 'bounce') looks like, as it is in its early stages still:

Chart Notations:
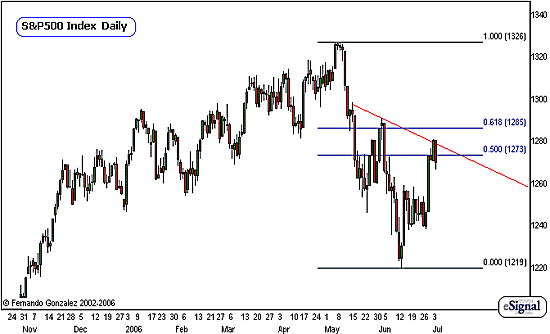
The daily chart of the S&P 500 addresses the short-term time horizon (3 mos or less)
Over here the impact of the wave of selling in May is very clear, and very large in comparison to the trend that preceded it. Note that the market had been rising slowly, but consistently over the prior 6 months leading into its high for the year.
At this point the correction of this decline is underway but still in its early stages. The Fibs as marked are going to play an important role, as well as the trendline (red), particularly over the very short-term market (10TD or less).
We are looking for the market to remain in this corrective range for at least the next two weeks before the market becomes vulnerable to another wave of selling.
For now, we shall consider the sell-off in May as the beginning of a larger decline later. Is it possible that the market goes to a new high? Yes of course - ANYTHING is possible in the markets. Is it probable? I believe that the risks to the downside in the intermediate-term market (6 to 1 year mos) exceed the risks to the upside.

Chart Notations:
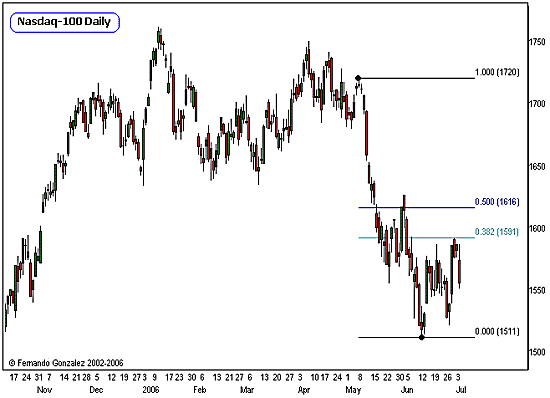
The daily chart of the Nasdaq-100 addresses the short-term time horizon (3 mos or less)
Notice that the Nasdaq continues to be far weaker than the benchmark S&P 500. The magnitude of the bounce off the low point (which includes the post-fed meeting rally) has only extended to the 38% Fibonacci retracement point, where the S&P 500 exceeded its 50% mark.
Due to the speed of the decline in May, a recovery to new highs is very much out of play, and we can safely say that as of this moment, it is completely out of the question. We shall look for the current corrective environment, which is a narrow range one, to continue for another two weeks at least before the market once again is vulnerable to another round of selling.
The Nasdaq continue to be the "weak link" of the US equity markets, and within the Nasdaq, we shall see on the next chart, one of the roots of its weakness, which is the semi-conductor sector:

Chart Notations:
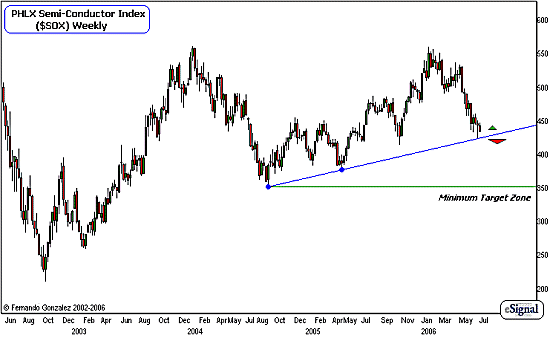
The Weekly chart of the PHLX Semi-Conductor Index above, popularly known as the $SOX, addresses the short-to-intermediate-term time horizon (3 to 9 mos)
Let us note first that the price action we see reflected in the charts above is preceded - and dwarfed - by a huge decline that is out-of-view in this chart. The long-term trend is still very strongly in favor of the Bears here.
As we can see above, semi-conductors have been trading in a range for the last few years. At this point this market is testing a primary degree trendline (blue) for this time horizon, and due to the speed of this decline, and the direction of the long-term trend, the odds favor that the SOX will break this trendline. Let us not jump the gun though, as we want to see it give-in a little before we establish that the SOX is vulnerable to movement towards multi-year lows (green support line).
There is a very good reason why we need to observe the SOX on this time horizon. If the Nasdaq has lead this decline since the market started in May, and the SOX is leading the Naz, then it will only be wise for us to make sure we have the technical bases covered in this market in order to properly estimate the future behavior of other equity markets.
Fernando Gonzalez is in his 10th year as an active trader, technical analyst and content contributor to the active trading community and a long list of popular financial media. Online Trading Academy trading knowledge...your most valuable form of capital.