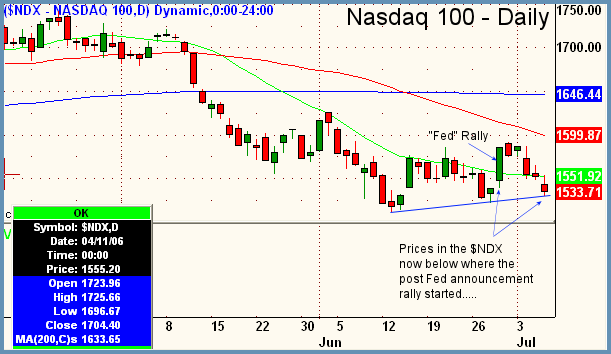
Good Morning, Traders. the end of a holiday shortened week ended on a bearish note as the Dow ticked down by 135, the S&P retreated almost 9, and the Nasdaq Composite declined by 25 in Friday's trade. Breadth was negative on both exchanges as were advance decline lines to the tune of -806 on the NYSE and -1325 on the Nasdaq. Over time we have been talking about how relative weakness in the Nasdaq seems to be acting as a leader, foreshadowing moves downward in the S&P and Dow. Moreover, the leading stocks in the Nasdaq, names like YHOO, AAPL, EBAY, etc., that most people know and trust are selling off first ahead of the entire Nasdaq Composite as a whole. So, for today's chart, the Big Picture selects the Nasdaq 100 ($NDX) as the chart of the day to illustrate this. On your own, you can pull up $SPX, $INDU, and $COMPQ charts for comparisons to play along at home. In the chart below, we have annotated the "Fed" rally of June 29. If you go to the aforementioned broad market charts of the other indices you will see that to a varying degree some portions of this rally are still intact in those indices. However, with the Nasdaq 100 stocks, not only has the rally completely evaporated, but prices are now below where that rally started. Additionally, note the lower blue mildly ascending trendline connecting recent lows. These leading Nasdaq 100 stocks are now sitting right on that trendline and look poised to break down further. This would of course have repercussions for the entire Nasdaq Composite (which should follow), and then continue to make it more difficult for the S&P and Dow to advance from these current levels. Overall bias remains down in the Nasdaq and sideways in the S&P and Dow, for now.

Focus List
Centex Corporation

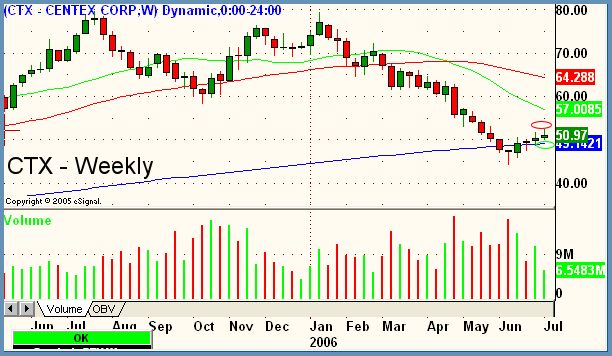
CTX - Centex Corporation
Industry - Home Construction
Side - Short
Trigger - 50.65
Stop - 52.57
Target - 44.50-
Timeframe - multiweek to multimonth
Notes
- $DJUSHB (Homebuilders Index, not shown) continues to be one of the most bearish charts out there, showing extreme relative weakness to broad market
- Just one of many stocks in this sector, all charts look similar: RYL, TOL, KBH, LEN, etc
- Trade parameters are off of daily charts (not shown) where Friday's action left a tall topping tail doji
- Target listed is to prior swing lows
- XHB can act as a proxy for entire sector but volume is light in this relatively new ETF
Group 1 Automotive

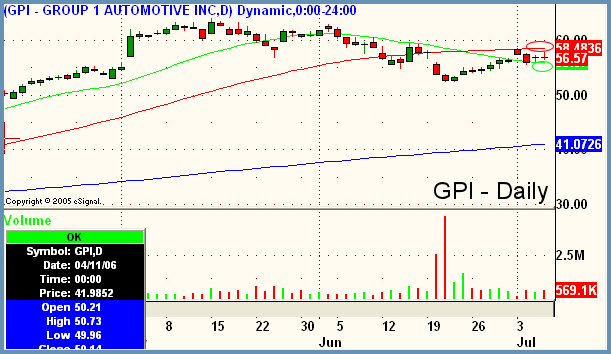
GPI - Group 1 Automotive
Industry - Specialty Retail (Auto Dealerships)
Side - Short
Trigger - 56.21
Stop - 58.65
Target - 50.00
Timeframe - multiweek to multimonth
Notes
- Volume on the recent sell-off was enormous indicating that a recovery here may not happen and a trend change is in place
- Weekly charts show parabolic rise over 2006 which will offer no technical support if prices begin to move back down through that rise
- Bearish topping tail on dailies along with 50ma (red) above for resistance (stop) point
Hooper Holmes Incorporated

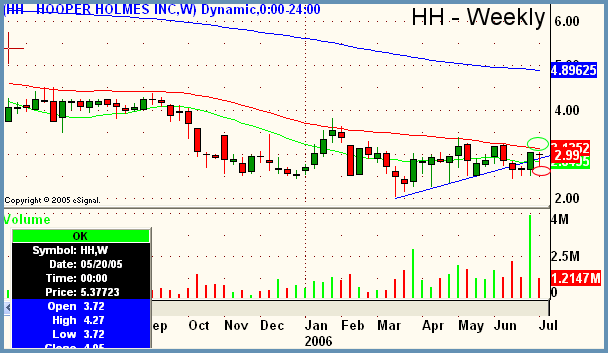
HH - Hooper Holmes Incorporated
Industry - Health Services
Side - Long
Trigger - 3.09
Stop - 2.65
Target - 4.00+
Timeframe - multiweek to multimonth
Notes
- Low priced issues tend to have a good amount of volatility when examined on a % of price; size accordingly
- Large volume spike of last week on strong advance indicates there may be some interest here
- Consider adding to position over recent swing highs if advance occurs
Peter Reznicek is the Chief Equity Strategist and a principal of the Prana Fund, a domestic hedge fund, and ShadowTrader, a subsidiary of thinkorswim which provides coaching and education to its clients on both intraday and swing trading of equities. For a free trial to the full version of The Big Picture or to learn about ShadowTrader's other services, visit shadowtrader.net or send an email to preznicek@shadowtrader.net.