The release of the employment data on Friday appeared to provide confusing cross currents for traders. While job growth was weaker than expected which tends to support the Fed is almost done view, there were elements in the report relating to wage inflation and capacity constraints that could prolong the tightening. The initial pre-market reaction in the futures markets was positive but as the day wore on the stock indices continued to weaken. The DJIA was the weakest index on the day as it dropped 134 points (0.8%) but MMM (see below) was a major factor as it announced an earnings warning.
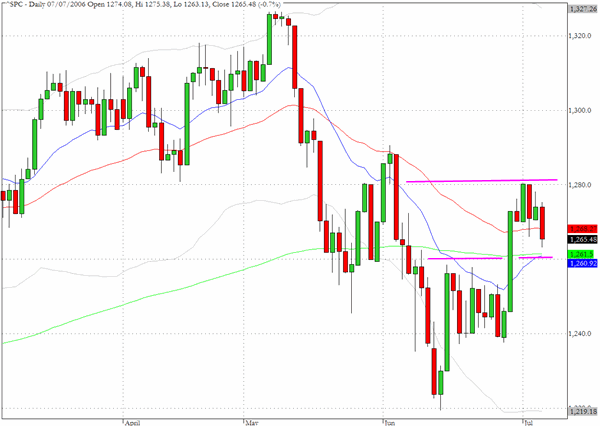
The S&P 500 confined its loss to 0.7% and closed at 1265. As we discussed last week the index remains between 1260 and 1280 which is a kind of safety zone before traders have to decide which way the markets are headed.
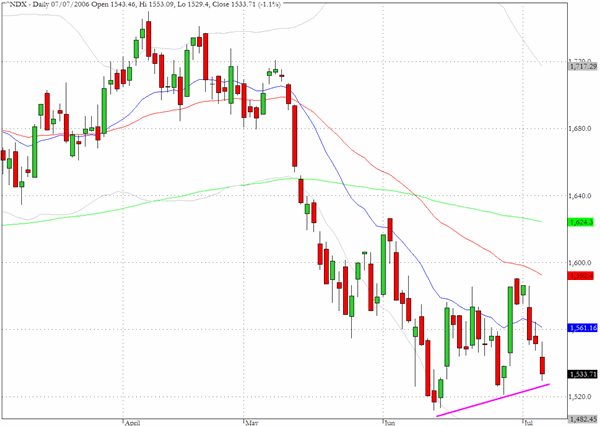
The Nasdaq 100 (^NDX) continues to show relative weakness and declined by 1.1% to 1533. The rising trend line through the lows since mid June is still intact but it will be revealing to see whether Friday's low of 1529 holds as further price erosion would suggest that the mid June low of 1511 may have to be tested.
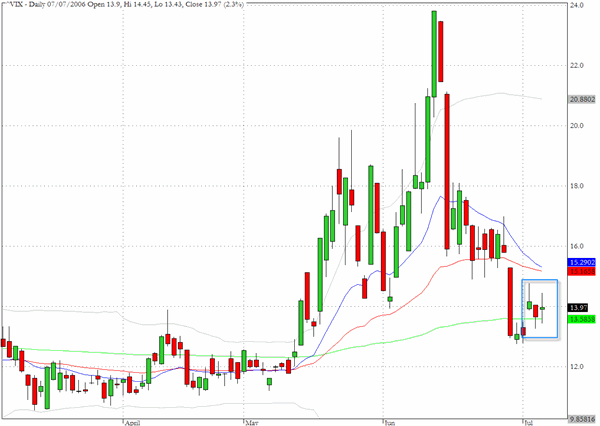
Despite Friday√Ę‚,¨‚"Ęs general market weakness the CBOE Volatility index experienced a rather restrained session and moved within a narrow range. The behavior of this index within the context of the ever increasing popularity of long/short strategies suggests that traders may have to re-examine the usefulness of this gauge of fear/complacency. This issue is dealt with in a forthcoming book by the author.
Oil prices reached an intraday record of $75.78 a barrel on Friday before settling back to close at $74.09.The oil sector index (^XOI) also moved back close to its mid April highs but closed with a pronounced Shooting star formation.

TRADE OPPORTUNITIES/SETUPS FOR MONDAY JULY 10, 2006
The patterns identified below should be considered as indicative of eventual price direction in forthcoming trading sessions. None of these setups should be seen as specifically opportune for the current trading session.
MMM dropped 9% on Friday after an earnings warning and this was a major factor in the under-performance by the Dow Jones Industrials. As the chart reveals the stock has fallen back to its pre-gap levels form March. The money flow and momentum charts show that the breakout in early April can best be described in hindsight as an opportunity provided, that some institutional investors took, to lighten up on their holdings.

We mentioned Overstock (OSTK) last Friday and would reiterate our view that it looks ready to rally from an extended basing pattern.
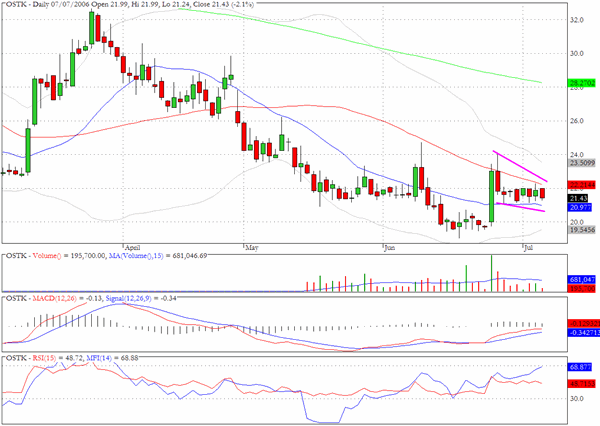
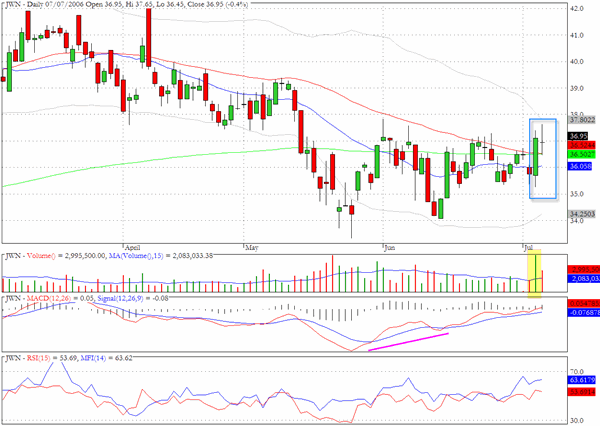
Nordstrom is showing evidence of accumulation but the stock may form more of a pullback channel before it advances further.
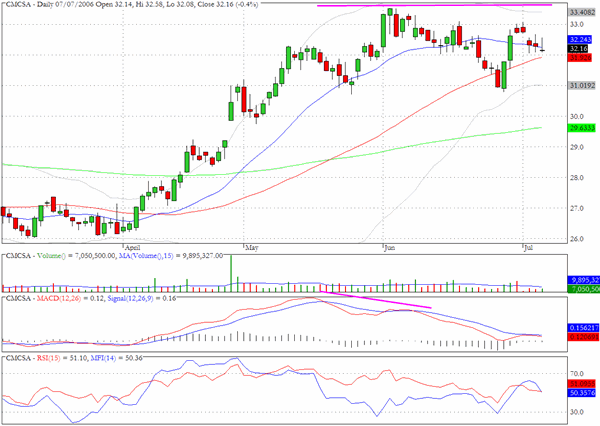
Comcast could be in the process of confirming a lower recent high as momentum continues to fade.
Clive Corcoran is the publisher of TradeWithForm.com, which provides daily analysis and commentary on the US stock market. He specializes in market neutral investing and and is currently working on a book about the benefits of trading with long/short strategies, which is scheduled for publication later this year.
Disclaimer
The purpose of this article is to offer you the chance to review the trading methodology, risk reduction strategies and portfolio construction techniques described at tradewithform.com. There is no guarantee that the trading strategies advocated will be profitable. Moreover, there is a risk that following these strategies will lead to loss of capital. Past results are no guarante of future results. Trading stocks and CFD's can yield large rewards, but also has large potential risks. Trading with leverage can be especially risky. You should be fully aware of the risks of trading in the capital markets. You are strongly advised not to trade with capital