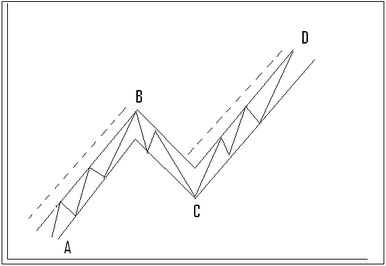
The measured move, or swing measurement, is the name given to the phenomenon where a major market advance or decline is divided into two equal, parallel moves. In order for this pattern to work in stock trading, the moves should be orderly and well defined. The measured move is a variation of other consolidation patterns like the pennant and flag or the wedge and triangle. It is a known fact that the market tends to retrace one-third to one-half of the prior trend before resuming the trend.
Look at the below graph of a measured move. When a trader sees such a well defined situation, with a rally from point A to point B, followed by a retracement countertrend swing of one-third to one-half (points B to C), it's expected the next move, from points C to D, in this uptrend will be for the leg to duplicate the first leg (points A to B). The height of the AB leg is measured upward from the bottom of the correction at point C.

Let's take a quick look at Google Inc. (GOOG) in preparation for today's trading session. The stock was hit hard Friday afternoon, and is now trading in between a few significant levels that must be noted.
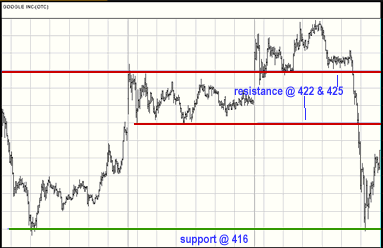
GOOG found support at 416 during Friday's sell off. The support level was carried over from Wednesday's trading session, and should proven solid in the event GOOG continues to see selling pressure. There will also be significant intraday resistance at 422 and 425. 422 is previous support from a consolidation pattern between 422 and 425 that will now act as resistance. 425's resistance is a combination of recent support and resistance.

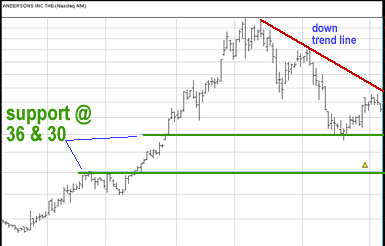
The Andersons, Inc. (ANDE) is making a turn to the down side after reaching down trend line resistance in recent trading. Recent support was found at 36. Nevertheless, the stock only found support at 36 after making a new low in relation to its recent down trending activity. In the event ANDE moves below 36, there is a major resistance turned support level at 30. It is at these levels that I can really see a bottom.

Andy Swan is co-founder and head trader for DaytradeTeam.com. To get all of Andy's day trading, swing trading, and options trading alerts in real time, subscribe to a one-week, all-inclusive trial membership to DaytradeTeam by clicking here.