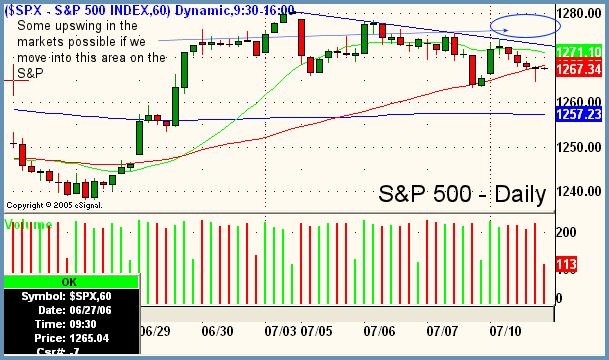
Good Morning, Traders. A small gap up on the morning of the offical kick-off to earnings season faded midday and continued to do so until the gap was filled. All averages moved back to Friday's closing levels. As usual, the Nasdaq got hit the hardest with the trendline that we described in the $NDX in Monday's issue getting violated to the downside causing a 13-point slide in the Nasdaq Composite. With the S&P and Dow managing to close positive by a hair on a late day bounce, we are still relatively rangebound in the bigger picture. If you look at the hourly chart below, you can clearly see that July has not been very big on volatility so far. The entire month's action to date (which admittedly has only been a few days with the holiday closings factored in), has been a controlled sideways move after the upward surge of June 29. Overall volume throughout this period has been light. Normally, this would be a recipe for another leg upwards, but the volume is possibly a seasonal consequence, and we must take into consideration as well that the Nasdaq Composite has not held up well during this consolidaion in the S&P at all. So, an immense amount of mixed signals at this juncture as the S&P sits right on a 200-day moving average (not shown).

Focus List
Sterling Construction

STRL - Sterling Construction
Industry - Construction
Side - Short
Trigger - 28.10
Stop - 29.40
Target - 22.00
Timeframe - multiweek
Notes
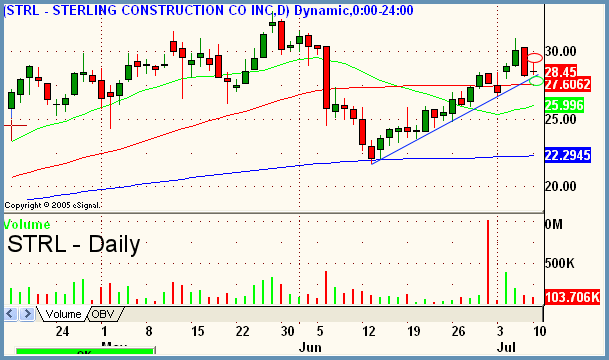
- This recent advance has been on a serious decline in volume
- Short entry under inverted hammer with stop above which also denotes break of trendline
- Target to retest 200ma daily (blue) which was prior swing low area
Oceaneering International, Inc.

OII - Oceaneering International, Inc.
Industry - Drilling & Exploration (Oil & Gas)
Side - Long
Trigger - 43.29
Stop - 40.80
Target - 47.00+
Timeframe - multiweek to multimonth
Notes
- Pullback to 20ma daily (green)
- Retracement ending in doji, indicating abatement of selling
- Use daily doji candle as trigger (above) and stop point (below)
Peter Reznicek is the Chief Equity Strategist and a principal of the Prana Fund, a domestic hedge fund, and ShadowTrader, a subsidiary of thinkorswim which provides coaching and education to its clients on both intraday and swing trading of equities. For a free trial to the full version of The Big Picture or to learn about ShadowTrader's other services, visit shadowtrader.net or send an email to preznicek@shadowtrader.net.