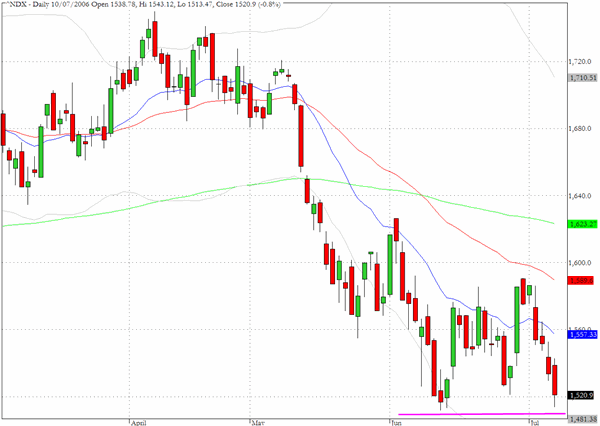
The Nasdaq 100 (^NDX) is on the verge of registering a new 52 week low. The index reached 1513 intraday yesterday which was two points above the June 13th low. Looking further back the October 2005 lows were slightly above at 1515 and one has to go back to July 7, 2005 (the day of the terrorist attacks on the London subway system) for the most recent low at 1503.
The Russell 2000 (^RUT) reveals an interesting candlestick formation that is probably best described as an inverted hammer/Doji as it closed near to its open and low for the day with a long upper shadow. The index is poised between the 50 day EMA at 716 and the 20 and 200 day EMA's which lie slightly below yesterday's close. We have made the point several times recently but the indices continue to struggle with indecision and it seems that Friday's employment data did little to clarify matters for trading desks.

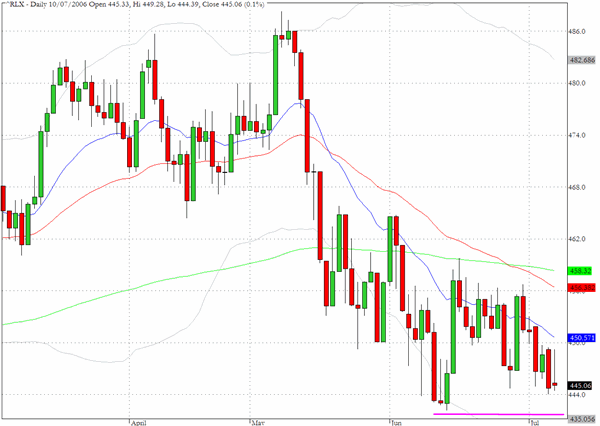
The chart for the retail sector (^RLX) since the beginning of June has a strong resemblance to that for the Nasdaq 100 that we previously examined. Also evident is the inverted hammer/Doji formation that we saw on the Russell 2000 chart. Institutions are showing their preferences regarding sector exposure quite clearly at the moment - retail, technology, especially semiconductors and housing related stocks are out of favor and consumer staples, energy and the pharmaceuticals are showing relative strength.
TRADE OPPORTUNITIES/SETUPS FOR TUESDAY JULY 11, 2006
The patterns identified below should be considered as indicative of eventual price direction in forthcoming trading sessions. None of these setups should be seen as specifically opportune for the current trading session.
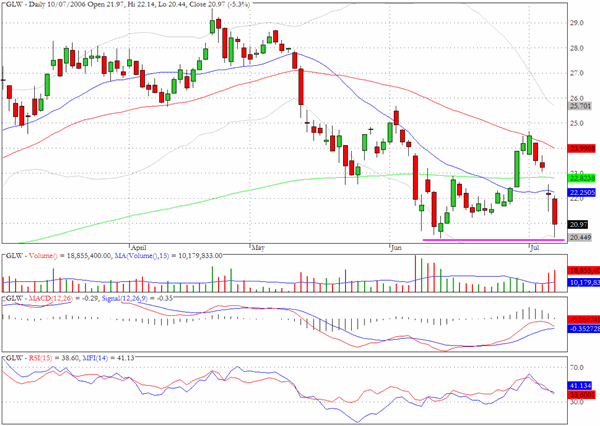
Several institutional favorites dropped more than five percent in yesterday's trading including Corning (GLW). As the chart reveals the stock could be testing the mid June lows. Volume has picked up in the last couple of sessions and we will be watching the stock closely in coming days to see whether institutional investors regard this as an exit signal or opportunity to acquire the stock at its 2006 lows.
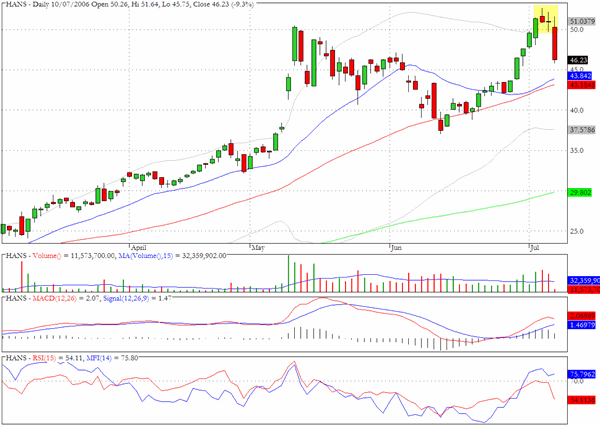
Another institutional favorite, Hansen Natural (HANS) dropped more than nine percent in yesterday's trading although volume was subdued at about one third of the average daily volume. The highlighted upper tails are suggesting that there is a lot of overhead resistance above $50 but whether the stock, which has exhibited positive alpha consistently, is on the verge of a significant correction remains to be seen.
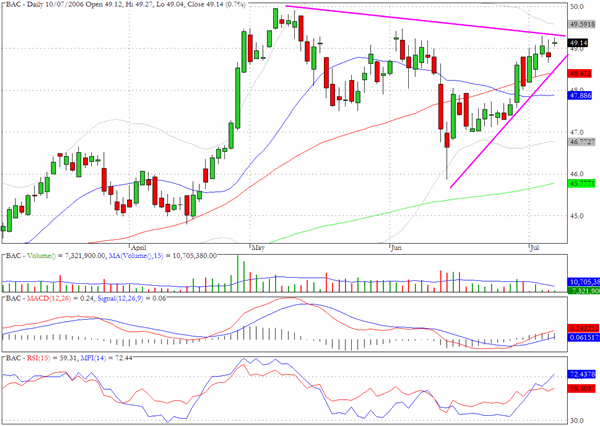
Several banking stocks are at a critical juncture where they are either about to break above the recent range or are in danger of registering a series of lower highs. Bank of America (BAC) is one and the tiny Doji candlestick recorded yesterday highlights the predicement.
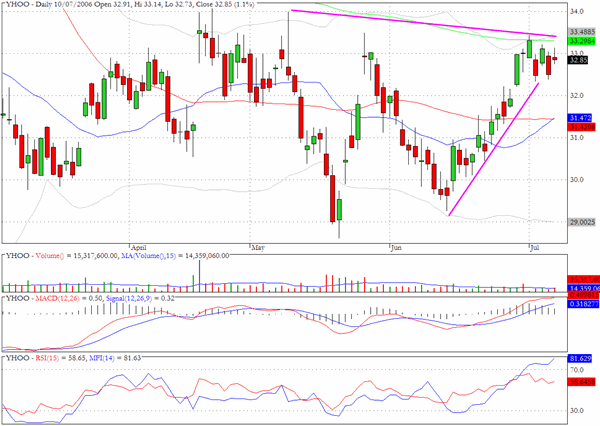
Yahoo (YHOO) has been struggling for some time to break above its 200 day EMA and faces similar issues to those on the chart for BAC.
Clive Corcoran is the publisher of TradeWithForm.com, which provides daily analysis and commentary on the US stock market. He specializes in market neutral investing and and is currently working on a book about the benefits of trading with long/short strategies, which is scheduled for publication later this year.
Disclaimer
The purpose of this article is to offer you the chance to review the trading methodology, risk reduction strategies and portfolio construction techniques described at tradewithform.com. There is no guarantee that the trading strategies advocated will be profitable. Moreover, there is a risk that following these strategies will lead to loss of capital. Past results are no guarante of future results. Trading stocks and CFD's can yield large rewards, but also has large potential risks. Trading with leverage can be especially risky. You should be fully aware of the risks of trading in the capital markets. You are strongly advised not to trade with capital.