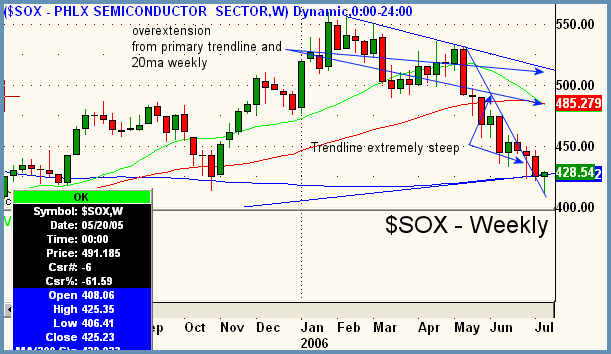
Good Morning, Traders. A late day report from semiconductor stalwart, KLA-Tencor (KLAC) turned around an otherwise bearish day, ripping the markets to new highs and closing positive in yesterday's trade. After trading negative in the morning session, the reversal caused a positive close in the Dow of 31.22, a gain in the S&P of 5.18, and an uptick in the Nasdaq Composite to the tune of 11.93. Overall volume kicked in on the reversal and closed up an average of 23% on both exchanges. The late day strength in the semiconductors brings us to our chart of the day which is the $SOX on a longer (weekly) timeframe. I coach clients to know that the Philadelphia Semiconductor Index is an internal indicator in and of itself and is regarded as extremely important in guaging sentiment and direction, much like our use of the advance decline line, breadth readings and TRINS. That being said, it is important to note just how far the semis have sold off recently and the fact that they may be setting up for a bounce here shortly, which might pull the Nasdaq and then the S&P upwards a bit with it. In the chart below, note the overextension from the primary trendline (upper blue) and also the 20-period weekly moving average. In the markets, there is always sector rotation as institutional money flows out of one area and into another. It's apparent from the chart that semis are currently out of favor. However, we must note that even if there is only a sideways correction here and not an all out bounce, the oversold condition will correct itself one way or another. Before skipping down to the focus list plays for today, note also the trendline moving along the bottom of the chart. This support is from lows of September of 2004 and also corresponds to a 200ma weekly support level as well. This confluence of technical support levels along with the overextension from the primary trendline is what may shake things up for the bears at least in the near term. Be careful out there. S&P continues to languish near its 200-day moving average and is also at a pivotal point where it needs to "make or break." That, coupled with earnings season getting under way in earnest could make for an interesting rest of the week.

Focus List
Corus Bankshares

CORS - Corus Bankshares
Industry - Banking
Side - Short
Trigger - 25.65
Stop - 27.10
Target - 22.50-
Timeframe - multiweek
Notes
- Company is quite leveraged to the South Florida condo market
- After strong move down on weeklies, stock has shown no evidence of covering or bounce
- Stock tested prior swing lows and has next support at 200ma weekly (not shown) at $20.63
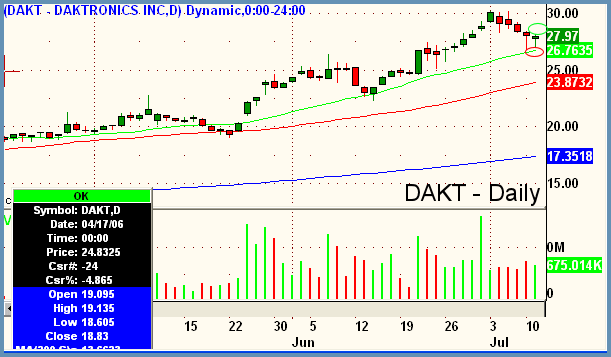
Daktronics Incorporated

DAKT - Daktronics Incorporated
Industry - Electronics (Displays)
Side - Long
Trigger - 28.22
Stop - 26.85
Target - 30.00+
Timeframe - 3 days to multiweek
Notes
- Pullback to 20ma daily (green)
- Retracement ending in doji, and bottoming tail on previous day indicating support in this area
- Market enviroment is not condusive right now for long buy and holds so trail stops tight and take profits
- Stock is slightly overextended on weeklies but not yet showing signs of slowing
Peter Reznicek is the Chief Equity Strategist and a principal of the Prana Fund, a domestic hedge fund, and ShadowTrader, a subsidiary of thinkorswim which provides coaching and education to its clients on both intraday and swing trading of equities. For a free trial to the full version of The Big Picture or to learn about ShadowTrader's other services, visit shadowtrader.net or send an email to preznicek@shadowtrader.net.